Commun.Fac.Sci.Univ.Ank.Series A2-A3 Volume 60, Number 2, Pages 103-128 (2018) DOI: 10.1501/commua1-2_0000000118 ISSN 1303-6009 E-ISSN 2618-6462
http://communications.science.ankara.edu.tr/index.php?series=A2A3
Received by the editors: September 03, 2018; Accepted: October 09, 2018.
Key word and phrases: Enhancement, intelligent device, energy efficiency, building.
© 2018 Ankara University Communications Faculty of Sciences University of Ankara Series A2-A3: Physical Sciences and Engineering
ENHANCEMENT OF A LOW-COST INTELLIGENT DEVICE FOR IMPROVING ENERGY EFFICIENCY IN BUILDINGS OĞUZHAN TİMUR, KASIM ZOR, ÖZGÜR ÇELİK and AHMET TEKE
Abstract. Ascending energy demand and vanishing nonrenewable energy resources have increased the prominence of energy efficiency nowadays. In order to accomplish an energy efficient future for the forthcoming generations of humanity, traditional devices possessing low efficiency should be altered with intelligent devices having high efficiency. Thanks to internet of things (IoT), conventional devices have been turned into intelligent devices which can be remotely accessed, monitored and controlled by utilizing ubiquitous sensor mechanisms. In this study, enhancement of a low-cost intelligent device (iDev) is targeted to develop in order to compute and store electrical energy consumption into a database by an embedded card named as Arduino which has the capability of measuring voltage, current, frequency and power factor for improving energy efficiency in buildings. When a classic device is connected to the enhanced iDev, the device is converted to an intelligent device that is remotely controllable. As a consequence, if a whole building is equipped with the proposed iDev, it is considered that a large amount of electrical energy will be saved for a better and livable Earth.
1. Introduction
Energy is an indispensable necessity for human life. Technological developments, which push imagination limits of mankind, have caused an increase in energy demand. The rapid depletion of fossil fuels has enhanced the value of energy by making energy efficiency and energy saving compulsory. Dependency on fossil fuels has not died out completely because of the fact that the amount of energy production from renewable energy sources does not cover the whole demand. Utilization of advanced technology with an ascending trend indicates that increase in energy consumption will proceed in terms of future expectations [1].
Expanding awareness related to conscious consumption becomes more of an issue in order to avoid a future energy crisis. It is meaningless to estimate how much energy is saved without measuring how much energy is consumed. In such a case, it is impossible to mention about energy saving or energy efficiency. It is probable to determine the energy consumption amount of a device by carrying out measurement of the used device. Evaluating the measured values and creating scenarios with respect to the results of these evaluations are essential steps in energy management. By energy management, while energy saving is realized by preventing from unnecessary use of existing energy, energy efficiency is also provided by consuming less energy simultaneously [2].
Energy consumption of devices should be kept under control 24/7 continuously. Auto-measurement of energy consumption amount via a computer is important from the point of view of data integrity. The requirement for controlling itself constantly has led to the emergence of "smart" and "intelligent". These concepts are used interchangeably in the literature. As a result of the measurements, saving scenarios should be identified by creating energy consumption profile of each device. Energy savings should be accomplished without lowering current living standards. Control and management by developing intelligent systems rather than direct human controlled inspections will increase the efficiency [3].
When energy consumption is investigated on a sectoral basis, it is seen that buildings have a significant place. In the investigated studies, buildings consume 40% of annual energy cost in U.S., and 30% of energy consumption is wasted [4], [5]. The energy consumption of buildings during the whole life cycle is responsible for 40% of total European Union energy consumption too. In addition, greenhouse gas emissions since buildings account for 36% of EU’s total CO2 emissions. Future projections indicate that in 2030 buildings will be responsible for 35.6% of primary energy use in the world, and continue to maintain its importance [3], [6].
Thanks to the construction of smart buildings and production of smart devices, more efficient utilization of energy sources has been provided. Furthermore, owing to embedded software programs, self-operating systems have been devised without the need of expensive computers. New intelligent systems have been developed by adding data storage units and the Internet, and this new system is named as the Internet of things (IoT) in the literature. Non-intelligent devices are turned into intelligent devices by creating intelligent networks which have provided communication particularly by preferring wireless connections among each device and between larger systems.
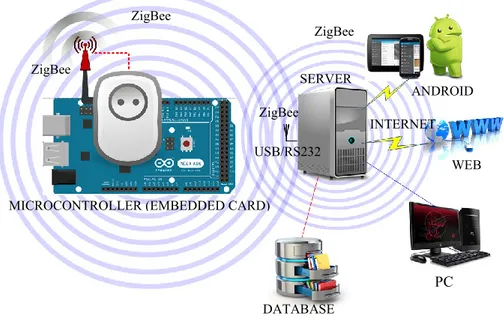
In this paper, iDev is aimed to design in order to compute and store electrical energy consumption into a database by an embedded card, namely Arduino which measures
voltage, current, frequency and power factor as shown in Figure 1.1. When a traditional device is connected to the proposed iDev, the device turns into an intelligent device that is remotely controllable.
Figure 1.1. Schematic view of iDev
When previous studies are investigated, it is seen that wireless technologies are utilized in order to prevent new cable installation and labor costs. When compared to existing wireless technologies, because of security, low power consumption and, low cost, ZigBee/IEEE 802.15.4 wireless communication protocol has been preferred. ZigBee protocols can be used pair, star, mesh and other networking structures. Especially, mesh networking allows for reliable data transfer and it is flexibility in networking with multiple topologies. Data integrity verification and authentication are realized by using 128-bits AES (Advanced Encryption Standard) encryption algorithm at the MAC (Media Access Control) layer. ZigBee does not require any license for the wireless communication. Data which has 2.4 GHz ISM (Industrial Scientific Medical band) and 250 Kbps data transmission capacity can be moved between 10 m and 70 m. Devices which communicate with ZigBee protocol in latest emerging technologies can be communicated until approximately 42 km [7-10].
Today, the most widely used wireless communication protocol is Wi-Fi. When the
ZigBee ZigBee ANDROID PC WEB DATABASE SERVER USB/RS232 INTERNET
MICROCONTROLLER (EMBEDDED CARD)
ZigBee
ZigBee delay time compares with Wi-Fi delay time in lighting switch control, ZigBee has less delay time. ZigBee is about twice as fast [11].
Performances of sending and receiving data for selected embedded cards which communicate by 802.15.4 ZigBee protocol have been investigated [12]. Imote2, Mega, TelosB, Arduino, Waspmote, and MicaZ boards have been examined in detail. The main goal of this study is to determine which board has the best performance. All boards have been tested with intensive data such as image and sound data. As a consequence of measurements, the communication delay time values shown in Figure 1.2 for a 100-byte packet. As illustrated in Figure 1.2, although Arduino and Waspmote boards are faster than the others at in sending data, they are slower than the others at in reading data. While sending throughput values are 10 ms and 11 ms for Arduino and Waspmote, reading throughput values are 35 ms and 50 ms respectively. According to measured delay times, the best performance belongs to MicaZ.
Figure 1.2. Communication delay times of some embedded cards [12]
When the previous studies are investigated, it is seen that the most used cards are Arduino and Raspberry Pi respectively in academic studies. In Turkey markets, almost all Arduino cards can be obtained easily. When Raspberry Pi compares with Arduino, it is second order. There are a lot of sample applications which are realized by using Arduino in literature. Because Arduino has many advantages, it has been chosen in this project.
2. Enhancement Of iDev 108 11 50 16.3 94 10 35 13 28.1 20.3 8 25.3 15.7 10.7 5 11.5 29.9 25.6 5 24.3 0 20 40 60 80 100 120 Relay Time Sending Time Reading Time Packet Generation Time
The main objective of iDev project is to develop a plug that can be controlled and monitored remotely. It is aimed to measure and record the consumed energy amount of single phase 220 V devices by developed iDev. In addition, it is aimed to control the plug by switching ON/OFF remotely. It is aimed to realize the remote monitoring and control of the plug by Windows, Web and Android based applications. Critical set values of measured values are determined and in case of exceeding these values, the energy connection of the devices are going to be automatically turned off. As a result of analyzing the recorded data, it is aimed the save energy by using energy more efficiently.
In this project, first of all, material selection is made in accordance to required properties for iDev. The implementation of material selection is done by following to perform accuracy tests of materials. It is targeted to measure voltage, current, frequency and cos φ values while the iDev is designed. By these measured values, it is going to be possible to calculate the power consumption of the device which is plugged into the iDev. Furthermore, relay with the microcontroller is used to switching the power supply of plugged in device. The microcontroller plays a key role in the implementation of both control and monitoring functions.
Arduino microcontroller with the ATMEL microprocessor is chosen because of the ease of use, cost, and the amount of similar applications, availability from the market, and the wide range of sensors and other equipment that can be used with it. Essentially, an Arduino microcontroller comprises of Atmel microprocessor, USB serial programmer and power regulator units. Technical facilities for Arduino are given in Appendix A. The features of the Arduino Mega ADK include the Atmel 2650 processor, 54 digital I / O pins that can be used as 16-pulse PWM (Pulse Width Modulation) outputs, and 16 input pins that each of them are 10-bit analog. It has a 256 KB flash memory totally. There are 4 UART communication pins that one of them is for programming.
The specificities of the microcontrollers are rather sufficient for iDev project. There is need for one digital input pin to turn on/off the iDev. Moreover, there is also need for two analogs and two digital input pins to measure voltage, current, frequency and cos φ values of energized plug.
Different types of sensors and devices can be supported at the same time with microcontrollers that the design of it brings multitenancy. Hence, a temperature and humidity sensor is assembled to iDev in order to measure the temperature and humidity of the environment.
Following the design of iDev is completed, it is tested with a calibrated HIOKI brand device which can make accurate measurements, in order to determine the accuracy of the measured values. The results of test measurements indicate that measurements can be realized with a maximum accuracy between 2% and 3%.
It is seen in the literature that such embedded systems or microcontroller applications are specific according to project. In other words, the code that is used to control microcontroller is specific to application and it is difficult or impossible to make changes on the project or make an attachment to it. In order to overcome this problem a new system which is able to read the sensors and transmit data in spite of the type and intended use of sensors that can be mounted on them is designed. The main advantage of this system is opportunity of the standardized software usage by downloading it to another microcontroller in case of breaking down of the microcontroller. In addition, any microcontroller used elsewhere in the system can be removed and replaced directly, without any hardware or software modifications, in case of breaking down or alteration.
Development, maintenance, repair and training cost are minimized by this code standardization. Moreover, various applications that are required to be done can be realized in a simpler way.
Following the standardizing the codes, the electronic circuit is designed for microcontroller to switch the grid voltage and to read the voltage, current, frequency and cos φ. While the electronic circuit is being designed, the studies are performed by considering operating current and voltage of microcontrollers and other devices. The main objective of design is to make it practical, applicable, cost effective and coherent. Relay is preferred because of its ease applicability and cost advantage for switching operation.
In order to measure the grid voltage, step down transformer is used. Since the microcontroller only measures direct current, the output of the transformer is rectified and reduced with divider voltage resistors to keep it in the measurement limits of microcontroller.
The AC voltage from the step-down transformer is rectified by low power single diode, filtered with fairly low power capacitance and connected to one of the analog inputs of microcontroller in order to make measurement. In order to detect the minor variations in grid voltage, it is not rectified by full-wave and bridge diodes that can give better output and capacitor and filter circuits that can filter better. Half-wave rectification with a single diode reacts much faster than other rectification methods. The higher the quality of the rectifier and filter circuit, the more stable the voltage output will be, as the fluctuations from the network will compensate so well. This
contradicts the aim of detecting the voltage sensitively, in other words detecting the small changes in grid voltage for his project. While calculating the voltage divider resistors, it has to be considered that analog inputs of microcontrollers can stand to 5 Vdc voltage maximally. It is calculated by adding the safety margin that input voltage has to be 4 Vdc since maximum 5 Vdc voltage can be used. All calculations are made in according to 4 Vdc input value.
Since it is known that the main used voltage is 220 Vac, the voltage drop transformer ratio and the voltage divider resistors are selected as 100/1 in order to simplify the calculations. 2.2 Vdc voltage is provided to Arduino microcontroller as input voltage at the end of calculations. Microcontroller’s input voltage drops to 2.1 Vdc following the grid voltage drops to 210 Vac. Microcontroller’s input voltage steps up 2.3 Vdc following the grid voltage steps up to 230 Vac. If there is maximally 400 Vac input, the input voltage of microcontroller can only be 4 Vdc maximally. Because of the input voltage can stands up to 5 Vdc, damage to the microcontroller is prevented consequently.
The rectifier which is at the output of step down transformer and voltage input at the output of filter elements are calculated as 6 Vdc when the grid voltage is 220 Vac. The calculations are made in according to the resistance which feeds the analog input of microcontroller is 2.20 Vdc voltage. The voltage of other resistor which is in voltage divider circuit is 3.80 Vdc. Total voltage is 2.20 + 3.80 = 6.00 Vdc.
According to these calculations, if the resistance which is connected to the analog input of the microcontroller is 2.20 units, the other resistance value has to be 3.8 units. Resistance values have to be calculated correctly. It is aimed to consume minimum power due to minimum current is drawn from the rectifier and filter circuit. If the voltage divider resistance values are kept low, both the power consumption increases and the desired response speed cannot be obtained due to the excessive load on the rectifier and filter circuit. Conversely, when the voltage divider resistance values are too large, sufficient current pass is not provided for microcontroller to measure. Therefore, measurements result incorrectly.
The voltage from the microcontroller to analog inputs is measured with 10-bit A/D converter (analog to digital converter) that is integrated into the microcontroller by converting it to digital. Since the microcontroller can accept input as a maximum of 5 Vdc, it corresponds to 10 bits i.e. 210 = 1024. It means that measurements can be made with 5/1024 = 0.00488 Vdc, approximately 5 mVdc, sensitivity. Since our measurement cycle ratio is 100/1, it means that the grid voltage measurement can be made with 0.005 Vdc x 100 = 0.5 Vdc sensitivity. This obtained sensitivity is
sufficient for the needs of this project. Besides, the sensitivity level is reached to 0.1 Vdc and 0.007 Vdc respectively for more sensitive measurements by using 12- or 16-bit A/D converters externally and the average of all the measured values is found and this information is presented to the user as the mean value of the voltage. ACS712 hall-effect current sensor is used for current measurement. The operation principle of hall-effect current sensor is finding a current that flows according to the amount of magnetic field generated by the current passing through a conductor. As the intensity of the current passing through the conductor increases, the effect of the magnetic field around the conductor also increases. The intensity of the current that is passing through the conductor can be calculated by measuring this generated magnetic field. The advantages of these sensors are that they can measure both AC and DC currents, they are sensitive and stable, and they provide good insulation even at high current ratings which are caused by the measurement of the magnetic field that is generated basically. Since it is calculated that the driven current in this project is 20 A, it is decided to use the ACS712 current sensor of 30 A by adding the safety margin. Since the alternating current measurement is performed, the current information from the sensor is continuously measured over a period of 1 second, and the current value is calculated by taking the average of all the measured values. Eventually, this average current value is sent to the user.
The voltage value which is obtained from the output of step down transformer for the measurement of frequency is applied directly to the inverting and non-inverting inputs of an Operational Amplifier (OpAmp), and an output voltage that is parallel to input voltage is obtained continuously except when the input voltage is 0 Vdc. Because of corresponding of this obtained output voltage to each half cycle of grid voltage that is given from input, frequency is double of input grid frequency. Researches on choosing proper OpAmp is completed and as a result, LM741 integrated circuit is preferred due to its wide operating voltage range, high input impedance and sensitivity, easy and cheap availability, rich documentation and application examples.
It is provided to generate an output signal for both positive and negative half cycles which are supplied from input by supplying OpAmp +/- 5 Vdc with a symmetrical power supply. In addition, the values that are higher than 5 Vdc are truncated and reduced to 5 Vdc through this symmetrical feedback voltage. This produced output signal is given to one of the digital inputs of the microcontroller. The microcontroller has a function that can measure how long the signal applied to the digital inputs come both in negative and positive direction. It is reached to total number of positive and negative half cycles by getting the duration of coming signal as microsecond and dividing it to 1 second time period. After that, this total number of positive and negative half cycles is divided by two to obtain the number of whole half cycles,
that is, the network frequency. Since the measurement is made in microseconds, frequency measurement can be performed very sensitively. Firstly, a literature review is performed and a practically applicable circuit design was not encountered for power factor measurement. The phase angle between current and voltage must be known for the power factor measurement. It is decided to design a circuit that can follow both current and voltage based on this theoretical knowledge. Based on the idea that the OpAmp circuit that is used in the frequency measurement circuit can generate signals for both voltage and current, one of these two OpAmp is connected to input voltage same as frequency measurement circuit and another one is connected to output of a current transformer which is used in order to detect the current drawn by the load. Output signals of both OpAmps are 0 where the input voltage is 0. In other words, if the one of these two signals is 0, the counter begins to count until the other signal is being 0. If we find the duration time between first signal zero points and second signal zero points, we can find the duration between these two signals. That is phase difference. There are two different methods to do this calculation.
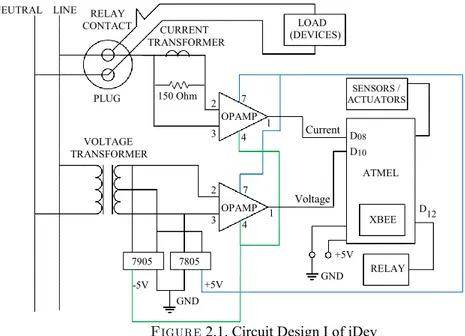
In the first method [3] in Figure 2.1, the output signals of the OpAmps are given to the digital inputs of the microcontroller. When one of these inputs is zero as a reference, a counter is operated and the other signal is expected to be zero and when the other signal is zero, the counter is stopped and the counter value is read. Thus, the phase difference can be measured as microseconds. It is necessary to work with a microcontroller which is fast and has a hardware interrupt support and sensitive counter for using of this method.
Figure 2.1. Circuit Design I of iDev
In Turkey, grid frequency value is 50 Hz and this means that one period is completed in 20 ms. In the realized project, measurement period is one second. If thousand ms divide into twenty ms, result obtains fifty. Because of measuring twice per period, a total of 100 measurements have been made. As a result of all measurement, the average value of total ms is calculated. Obtained value is converted to radian value and radian value is also converted into degree value. In order to obtain power factor, the cosines of obtained degree value should be calculated.
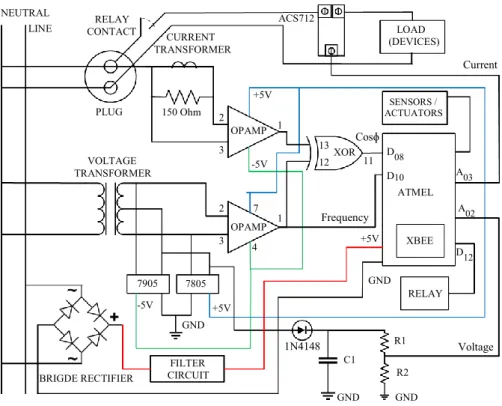
The other method used in the project is to connect an XOR gate to the output of the OpAmps. It is seen that there is a logic structure that gives a 0 output when the inputs are the same, and 1 when the inputs are different according to the truth table of the XOR gate. Since the aim of the power factor measurement is to find the difference between voltage and current, it is correct to use the XOR gate.
As long as the outputs of the OpAmps are different, in other words, as long as there is phase difference between the voltage and the current, the XOR gate outputs the logic 1 output signal. This output signal, obtained from the XOR gate, is given to a digital input of the microcontroller and how long the incoming signal remains at logic 1 level is measured in the level of microseconds at which the incoming signal remains at logic 1 level by the microcontroller. Since it is known that the grid frequency is 50 Hz, it is found that 1 full pulse is 1/50 equals 20 ms. Because of 1 full pulse is 360 degrees, 20 ms correspond to 360 degrees. In this case, if found duration in microsecond level is 20 ms and 360 degrees, the calculations are made
NEUTRAL GND -5V LOAD (DEVICES) ATMEL XBEE RELAY RELAY CONTACT SENSORS / ACTUATORS Current Voltage OPAMP VOLTAGE TRANSFORMER 7905 7805 LINE +5V +5V GND 2 2 3 3 7 7 4 4 1 1 CURRENT TRANSFORMER 150 Ohm D08 D10 D12 PLUG OPAMP
by proportioning. The power factor between the voltage and the current is found by taking the cosine of this angle. This method is preferred due to ease of programming, the proper fastness that is targeted for this project of XOR gate operation and ability to detect even small time differences. The measurement is performed during 1 second and the average of the measured values is taken and sent to the user. Designed circuit by using XOR is shown in Figure 2.2.
A power supply unit which supplies +/-5 Vdc to OpAmps via the circuit that is designed for measurements, and supplies power to the microcontroller, other measurement devices and relays at the same time is designed. A transformer which gives 2 voltage outputs is chosen as step-down voltage transformer. A 5 W transformer is chosen considering the power requirements of symmetrical supply voltages, measurement sensors and other components. The bridge wave rectifier for rectifying and the pi type filter for filtering are used.
Figure 2.2. Circuit Design II of iDev
LOAD (DEVICES) SENSORS / ACTUATORS ATMEL RELAY XBEE +5V +5V +5V -5V -5V OPAMP OPAMP XOR RELAY CONTACT CURRENT TRANSFORMER PLUG 150 Ohm ACS712 Current Voltage 1N4148 VOLTAGE TRANSFORMER BRIGDE RECTIFIER FILTER CIRCUIT 7905 7805 GND GND Frequency Cosɸ GND GND R1 R2 C1 D10 D08 A03 A02 D12 1 1 2 2 3 3 7 4 11 12 13 NEUTRAL LINE
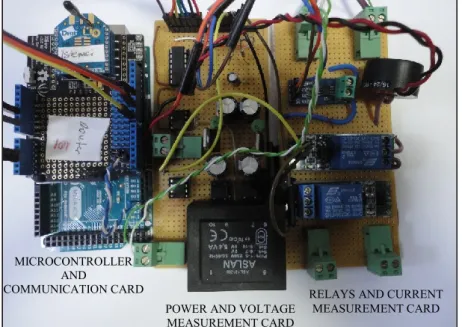
7805 and 7905 positive and negative voltage regulators which can regulate consistently are used for voltage regulation. It is prevented for obtained voltages to exceed +5 and -5 Vdc by these two voltage regulators. It is extremely important for fed power to be extremely linear and has the least noise because of demanding of power unit is a microcontroller, OpAmp and logic gates. In order to filter the noise that caused by regulators, the regulators are taken into pi type filters. Thus, it is possible to supply extremely linear and least noise power to demanding units. The selected circuit elements are assembled in according to calculations as shown in Figure 2.3. Application server software is developed following the connections that made between the designed circuit and the microcontroller card. It is provided to computer to read measurement results by the connection between embedded system software developed software and the embedded system to detect values entered to the computer. In addition, essential calibrations are made by test measurements of the designed circuit by means of this server software.
Figure 2.3. Implementation of iDev
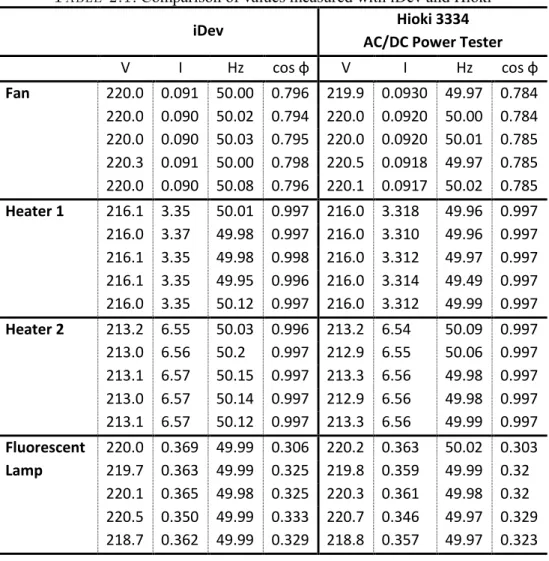
The implemented iDev design is tested on a 36 W fluorescent lamp circuit, fan and an electric stove that heats with resistance. Test results are shown in the Table 2.1.
MICROCONTROLLER AND
COMMUNICATION CARD
POWER AND VOLTAGE MEASUREMENT CARD
RELAYS AND CURRENT MEASUREMENT CARD
As seen on the table, it is observed that measurement is made with an accuracy between 2% and 3% maximally.
Table 2.1. Comparison of values measured with iDev and Hioki
iDev Hioki 3334
AC/DC Power Tester
V I Hz cos φ V I Hz cos φ Fan 220.0 0.091 50.00 0.796 219.9 0.0930 49.97 0.784 220.0 0.090 50.02 0.794 220.0 0.0920 50.00 0.784 220.0 0.090 50.03 0.795 220.0 0.0920 50.01 0.785 220.3 0.091 50.00 0.798 220.5 0.0918 49.97 0.785 220.0 0.090 50.08 0.796 220.1 0.0917 50.02 0.785 Heater 1 216.1 3.35 50.01 0.997 216.0 3.318 49.96 0.997 216.0 3.37 49.98 0.997 216.0 3.310 49.96 0.997 216.1 3.35 49.98 0.998 216.0 3.312 49.97 0.997 216.1 3.35 49.95 0.996 216.0 3.314 49.49 0.997 216.0 3.35 50.12 0.997 216.0 3.312 49.99 0.997 Heater 2 213.2 6.55 50.03 0.996 213.2 6.54 50.09 0.997 213.0 6.56 50.2 0.997 212.9 6.55 50.06 0.997 213.1 6.57 50.15 0.997 213.3 6.56 49.98 0.997 213.0 6.57 50.14 0.997 212.9 6.56 49.98 0.997 213.1 6.57 50.12 0.997 213.3 6.56 49.99 0.997 Fluorescent Lamp 220.0 0.369 49.99 0.306 220.2 0.363 50.02 0.303 219.7 0.363 49.99 0.325 219.8 0.359 49.99 0.32 220.1 0.365 49.98 0.325 220.3 0.361 49.98 0.32 220.5 0.350 49.99 0.333 220.7 0.346 49.97 0.329 218.7 0.362 49.99 0.329 218.8 0.357 49.97 0.323 3. Conclusions
iDev has been aimed to design in order to measure the electrical energy consumption of the devices real-timely. Energy saving has been provided by using embedded systems and wireless network protocol for measuring, monitoring, and controlling of electrical energy. Then, by comparing the current consumption with past
consumptions, a consumption pattern has been determined for each measured device.
By the iDev design, electrical energy consumption of the devices has been measured by the electric plug and delivered to the server software program. In order to determine how much electrical energy is consumed by which device, it is adequate to connect power supply of the device to the designed iDev. Values such as current, voltage, temperature, humidity, cos φ, and frequency have been measured and saved by sensors on iDev with respect to the specified sampling period. The amount of consumed power and energy of the device has been calculated with respect to the values. A software program operating on the server and all data received from the iDev have been stored in database files. Peak times and maximum energy consumption values in a day can be determined by analysis of the data in the database. Measurement results of the developed iDev have been tested by a calibrated device which measures more precisely. After test results, the error of the developed iDev has been confirmed as maximum between 2% and 3%. In the software, maximum and minimum levels of measured values have been identified parametrically and in case of a violation of these threshold values, an interruption in energy has been provided. Owing to this feature, the risk of electric shock has been kept at a minimum.
4. Future Work Recommendations
For taking this study a step further, recommendations for future work are given as follows.
If the developed iDev is used for all electrical appliances and illumination systems in households, entire energy consumption of households can be examined in details. At the present time, smart electricity meters can only measure the overall energy consumption of households without classifying the loads. Unnecessary consumption of specific devices or appliances of households can be determined and controlled in order to prevent from energy wasting by the developed iDev.
If the devised system is not only used for households but also for the entire building, the amount of electrical energy consumption of the whole building will be obtained and recorded. Moreover, it will be a guide for companies dealing with demand-side management whether the developed system is applied to the overall neighborhood. In case of using methods in the buildings or the neighborhood such as load shifting, etc., energy saving is foreseen.
Acknowledgement. The authors would like to thank the Scientific Research Project Unit of
Çukurova University for project named as “Design and Implementation of a Wireless Sensor Network for Energy Monitoring, Analysis and Management in Smart Buildings” and numbered as “FDK-2016-5772”.
References
[1] O. Timur, Design and Implementation of a Wireless Sensor Network for Energy Monitoring, Analysis and Management in Smart Buildings, Çukurova University Institute of Natural and Applied Sciences, PhD Thesis, 215 pages, 24 January 2018.
[2] O. Timur, K. Zor, O. Celik, A. Teke, Development of an Intelligent Energy Measurement Device for Buildings, 2nd International Conference on Theoretical and Applied Computer Science and Engineering-Summer (ICTACSE 2018), ISBN:978-605-9546-12-6, pp.16-21, JUNE 29 – 30, 2018. (Istanbul, Turkey)
[3] O. Timur, K. Zor, O. Celik, H.B. Yıldırım, A. Teke, Design and Implementation of Smart Energy Measurement Plug in Smart Buildings, Digital Proceedings of the 12th Conference on Sustainable Development of Energy, Water and Environment Systems (SDEWES2017), (0732), pp.1-12, 4-8 October 2017. (Croatia)
[4] L. Jiechao, A software approach for combining real time data measurement and building energy model to improve energy efficiency, Electrical Engineering and Computer Sciences University of California at Berkeley: Technical Report: UCB/EECS-2014-37. 14 p, 2014.
[5] A. Costa, M.M. Keane, J.I. Torrens, E. Corry, Building operation and energy performance: Monitoring, analysis and optimization kit, Elsevier: Applied Energy, Vol.101, pp. 310-316, 2013.
[6] H.U. Gokce, K.U. Gokce, Multidimensional energy monitoring, analysis and optimization system for energy efficient building operation, Elsevier: Sustainable Cities and Society, Vol.10, pp 161-173, 2014.
[7] O. Arslan, ZigBee ile Bina İçi Güvenlik Otomasyon Sistemi, İTÜ. Elektrik Elektronik Mühendisliği - Bitirme Tezi. 50 p, 2009.
[8] N.C. Batista, R. Melicio, J.C.O. Matias, J.P.S. Catalao, Photovoltaic and wind energy systems monitoring and building/home energy management using ZigBee devices within a smart grid, Elsevier: Energy, Vol.49, pp 306-315, 2013.
[9] C. Jin, A Smart Home Networking Simulation for Energy Saving, Master of Applied Science in Electrical and Computer Engineering at Carleton University, 2011.
[10] R.V. Sakhare, B.T. Deshmukh, Electric Power Management using ZigBee Wireless Sensor Network, IJAET: International Journal of Advances in Engineering & Technology, Vol.4, pp 492-500, 2012.
[11] K. Gill, S.H. Yang, F. Yao, X. Lu, A ZigBee-Based Home Automation System, IEEE Transactions on Consumer Electronics, Vol.55, No:2, pp. 422-430, May 2009.
[12] C. Pham, Communication performances of IEEE 802.15.4 wireless sensor motes for data-intensive applications: A comparison of WaspMote, Arduino, MEGA, TelosB, MicaZ and iMote2 for image surveillance, Elsevier: Journal of Network and Computer Applications, Vol.46, pp. 48-59, 2014.
Current Address: OĞUZHAN TİMUR: Çukurova University, 01330 Sarıçam, Adana, TURKEY
E-mail : [email protected]
ORCID: https://orcid.org/0000-0002-6537-7840
Current Address: AHMET TEKE: Çukurova University, 01330 Sarıçam, Adana, TURKEY
E-mail : [email protected]
ORCID: https://orcid.org/0000-0003-2610-9576
Current Address: KASIM ZOR: Adana Science and Technology University, 01250 Sarıçam, Adana, TURKEY
E-mail : [email protected]
ORCID: https://orcid.org/0000-0001-6443-114X
Current Address: ÖZGÜR ÇELİK: Adana Science and Technology University, 01250 Sarıçam, Adana, TURKEY
E-mail : [email protected]
![Figure 1.2. Communication delay times of some embedded cards [12]](https://thumb-eu.123doks.com/thumbv2/9libnet/3852331.35545/4.688.138.583.402.697/figure-communication-delay-times-embedded-cards.webp)