NUMBER : 1
Received Date : 03.03.2001
GENETIC CELLULAR NEURAL NETWORK APPLICATIONS
FOR PREDICTION PURPOSES IN INDUSTRY
M. ZIARATI
1D.
STOCKTON
2E. BİLGİLİ
31Department of Computer Engineering, Dogus University, Istanbul, Turkey
2Department of Mechanical and Manufacturing Engineering, De Montfort University, Leicester,UK 3Deparmtent of Electronic Engineering, Gebze Institute of Technology, Gebze, Turkey
TUBITAK-MAM, TUOAL, Gebze, Turkey
ABSTRACT
Genetic Cellular Neural Networks (GCNN) are adapted for predicting the required car parts quantities in a real and major auto parts supplier chain. It was argued that due to the learning ability of neural networks, their speed and capacity to handle large amount of data, they have a potential for predicting components requirements.
GCNN use less stability parameters than Back Propagation-Artificial Neural Networks (BP-ANN) and hence better suited to fast changing scenarios as in real supply chain applications.
The model has shown promising outcomes in learning and predicting material demand in a supply chain, with high degree of accuracy.
Keywords: Genetic Cellular Neural Network, Industry, Prediction, Expert Systems, Logistics
I. INTRODUCTION
In many supply chains irrespective of the methodology used to manufacture and/or distribute parts there is no unified and/or streamlined system for material and information flow up and down a supply chain or between supply chains themselves. While Material Required/Resource Planning (MRP) packages and their off-springs viz., Enterprize Resource
Planning (ERP) system have played a major part; these systems have no systematic capacity for learning, and hence rely on either “rules of thumb” or human decisions which could be case-related or subjective at a very least, or erraneous at worst.
The concept of neural networks is not new, they have been used in many related applications [1-4] and [12-21],but prediction of the required
number of components in a given supply chain is considered a new approach.
Prediction of components required and their flow through the chain irrespective of approach adopted should also enable production planning to be carried out and parts distributed to the right place at the right time. Demand prediction could also lead to the estimation of the pack sizes and delivery schedules. A learning model once fed with actual initial data, can only get better. The continuous nature of neural calculations when combined with use of actual data is considered a novel approach in prediction of component quantities and related production schedulings and parts delivery.
2. THE PROBLEM
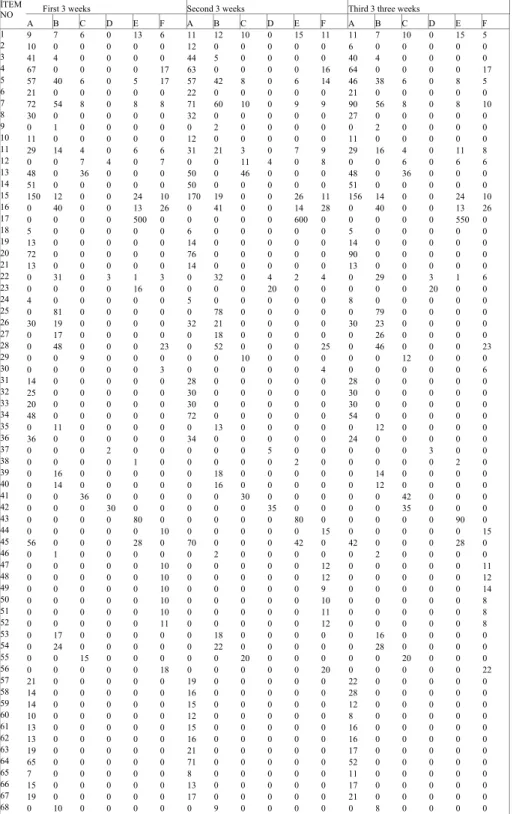
Table 1 shows a list of 69 auto components flowing through a supply chain and forwarded to 6 retail units, denoted as A, B, C, D, E and F down stream, over a 3-week period. The number of each product ordered by each retail unit can be observed in the table.
The quantities were ordered by using a MRP/ERP based system [5] as well as a number of empirical equations (rules of thumb).
The MRP/ERP system applied did not base its preditions on the past trends. The complexity of the Tables (ie. number of components involved, existing pack sizes, variation in demands by retail units, variation in time of orders and Economic Order Quantities (EOQs), etc, did not allow for a systematic evaluation of material and information flows through the supply chain. The information used by manufacturers in this case to interact with central and regional distribution centres, and the information used between the distribution units and retailers, were not unified and/or integrated through a single database. The knowledge obtained was not based on a meaningful learning mechanism of past dealings and activities.
3. THE SOLUTION
The intention here is not to compete with MRP/ERP systems currently used by commercial and industrial organisations. These systems have
proven extremely useful [6] in that, pay-off due to their introduction unlike other high-tech systems viz., CAD, CAM, robotics, etc, has been substantial. As reported in [6] the high pay-offs were due to the fact that MRP/ERP systems provide an opportunity for managers to know what is going on and hence able to co-ordinate activities within their organisation effectively and efficiently, for instance reduce stocks. The intention here is to complement the existing ERP systems. The neural network offers a learning mechanism which could help to predict demand trends more accurately (in terms of material quantities, pack sizes, EOQs, etc.) with due consideration for spatial and temporal requirements. There is no reason as to why a neural network ERP should not be a way forward in the near future.
An explanation of the neural network approach adopted for this problem is given in the following section. Immediately after, an explanation is provided as to how data was computed and how output data was obtained.
4. GENETIC CELLULAR NEURAL
NETWORKS
Cellular Neural Networks (CNN) were introduced by Chua and Kozek [7,8]. A general CNN neighbourhood structure is shown in Figure 1. The CNN structure is well suited for the computation of tabulated data. The CNN normalised differential state-equation can be described by matrix-convolution operators as:
I
U
B
Y
A
X
dt
dX
=
−
+
+
+
*
*
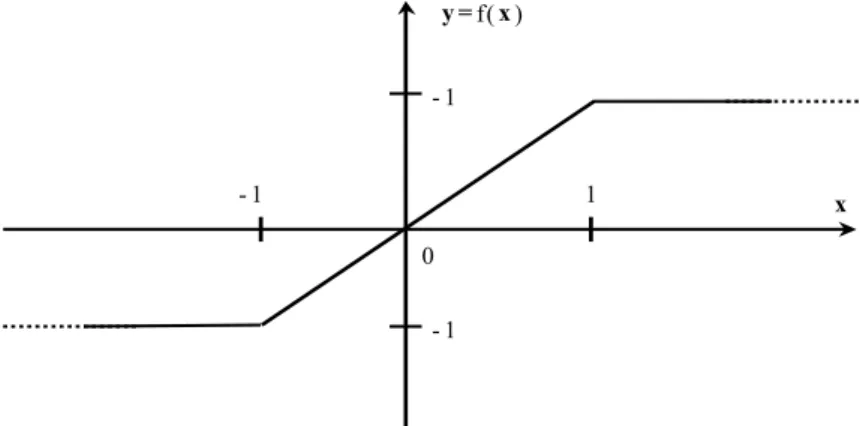
(1) where U, X, Y are input, state and output of an M x N matrix, while I is an offset vector. The model used for the input-output relationship is given in Figure 2. The feedback and feed-forward connections are represented by matrix A and B.The relationship between the state and output is non-linear as defined by the Equation below:
[
1
1
]
*
5
.
0
+
−
−
=
ij ij ijX
X
Y
(2)ij
Y
The characteristics of a CNN cell are governed by piece-wise variation as elucidated in Figure 3. The variation of the CNN output is governed by Equation 1. Therefore, iteration is stopped only when the derivative of the state variable (dX/dt) becomes zero, leading to an output value given by:
ij
Y
∞=
(3) For the CNN to be stable, Aand B should be symmetrical and the centre element of A must be ≥ 1 for a 3 x 3 matrix.
4.1 Genetic Algorithm
GCNN is a CNN incorporating a Genetic Algorithm (GA). GA is a learning algorithm which abides by rules of the genetic science. The algorithm has been successfully applied in a number of cases such as image processing, geophysics, etc. [4,9]. It uses a binary coding system to search for optimum values of A, B and I.
The process of natural selection causes chromosomes (in this case, a given set of A, B and I matrix elements) to be continually reproduced and optimised. In addition to reproduction, mutations may cause the off-springs to be different from those of their biological parents, and crossing over processes create different chromosomes in off-springs by changing some parts of the parents’ chromosomes. Like nature, genetic algorithm solves the problem of finding good chromosomes by a random manipulation of the chromosomes. The underlying principles of GA were first published by Holland [10]. The mathematical framework was developed in the 1960s and was presented in his pioneering book in 1975 [11]. In optimisation applications, they have been used in many diverse fields such as, function optimisation, image processing, travelling sales person problem, system identification and control and so forth. In machine learning, GA has been used to learn syntactically simple string IF-THEN rules in an arbitrary environment. A high-level description of GA as introduced by Davis in 1991 is given by [9].
Step 1&2 Constructing initial population and extracting the CNN templates
A chromosome is constructed consisting of the first five elements of matrixes A and B respectively, and value of I making a total of 11 different values (see equations 4 and 9). The other elements in matrixes A and B respectively have the same values as the corresponding first five (see equation 9). At the start the values for A, B and I are randomly constructed. In each chromosome the first 32 bits represent the first element (A1,1), and the second 32 bits of the chromosome represents the second element (A1,2) and so on. There are 11 different values in a given chromosome as elucidated below:
[
A A A A A B B B B B I]
S= 1,1, 1,2, 1,3, 2,1, 2,2, 1,1, 1,2, 1,3, 2,1, 2,2,
(4) Steps 3 - 6 Optimising chromosome
The CNN works with the matrixes of A, B, I belonging to the first chromosome. After, the CNN output appears is stable, a function is used to obtain the target value. This function is called the Cost Function which enables the target value to be computed from the output values. This process is repeated for each set of matrixes belonging to each chromosome in the population. The Cost Function used in this study is given below:
(
)
∑∑
= =−
=
M 1 i N 1 j 2 j , i j , iT
P
)
I
,
B
,
A
(
t
cos
(5)where Pi,j and Ti,j are the elements. The elements of Table 1 give the number of components ordered at any time by a dealer for each item for the first, second and third “3-week” period. This is the input matrix (P) for training purposes. A similar table to table 1 is composed of the values for the fourth, fifth and sixth “3-week” period used as a target matrix (T) for training purposes. Having found the Cost Function, the Fitness Function for each chromosome is determined by the following equation:
)
I
,
B
,
A
(
t
cos
1
1
)
I
,
B
,
A
(
fitness
+
=
(6)The criterion to end iteration is defined as follows:
Min. cost (A,B,I) <0.01 (7) where min represents the minimum value of the cost function defined in Equation (5). If the
) 1
minimum cost function value (or error) of the chromosome is smaller than iteration criterion (Equation 7), computation is concluded and the chromosome whose fitness value is the maximum in the population is selected. The matrixes which have been extracted from this selected chromosome are considered to be the optimum matrixes.
4.2 Application of GCNN in Demand
Predication within a Given Supply
Chain – an Example
This example is based on actual data obtained in a real supply chain. By using the data for training and testing, the following sections describe how the GCNN model works. First the neural model needs to be trained. The two datasets P and T are used in training. The P dataset consists of the quantities ordered (69 types of parts) by the six retail units during first three 3-week periods (weeks1-9). Similarly, T dataset includes quantities sold by the six retail units during the next three 3-week periods (weeks 10-18). Since the difference between maximum values and the minimum values of the dataset elements is large (viz., buying and selling some parts in 6s and 7s and some in 100s), the datasets have been transformed as follows:
log( 1= P+
P T1=log(T +1) (8)
The elements of both datasets P1 and T1 are divided by their maximum value. The same process is applied to the test datasets PP and TT for the third and fourth three 3-week periods (weeks 19-27 and weeks 18-36) respectively. In optimisation of A, B and I templates, GA is used. In GA, the chromosomes are deleted from the population after a given number of iteration (30 in this trials), and also if their fitness is below a certain threshold set by Equations 5 and 6. This procedure is known as reproduction process. Reproduction process does not generate new chromosomes. It selects the best chromosomes in the population and increases the number of the chromosomes whose fitness values are relatively greater than the others. At the end of the training process and after 143 generation later the following matrixes were found:
= 1.3125 4.1250 5.1875 6.3750 1.0000 6.3750 5.1875 4.1250 1.3125 A = 0.6875 0.1875 7.0000 6.0625 4.1875 6.0625 7.0000 0.1875 0.6875 B (9) I = 5.750
The best chromosome which holds the above values of A, B and I is given by:
S=[100001011110011000010000000000111000 100010110111100101010110100101100110010 100100101000000010111011011010110110001 010101111011001010010110110011001000010 000010010001100001000011001111110010100 011001110000101001010100000011001011100 110100110101100100100000001101011010100 001011011101100010101110100011110110100 111110110001111110010100000101001100000 0010] (10)
By using Equations 8-10, we can obtain GCNN output for training and testing as in shown in Figures 4 and 5. As a result, we can say that GCNN has promising applications in learning and predicting material demand in a supply chain.
5. CONCLUSIONS
This paper is an attempt to predict the optimum material and information flow for use by supply chains. A new stochastic algorithm, namely Genetic Cellular Neural Network (GCNN) is proposed. The training procedure is achieved by Genetic Algorithm (GA) which is based on a biological optimisation. Matrixes A and B respectively and the value of I are required for the CNN. Only 11 different matrix element values are necessary; hence computation is based on determining only 11 parameters as against 100s and sometimes 1000s parameters needed by other neural network algorisms. Such a limited and small number of parameter requirements make the neural iteration very short compared to other methods. Application of the existing bitmap and vector graphic techniques (Figures 4 and 5), used in image processing, presented in this paper, should be considered a novel approach in training of the neural networks and
their use in predicting material flow in a given supply chain. The bitmap concept has added a third dimension to the tabulated data and the application of vector graphics is expected to enhance the connectivity within the proposed neural network architecture. The new approach has promising outcomes in learning and predicting material and also information flow in a supply chain as shown in Figures 4 and 5. It has a potential to become a prediction tool within the existing ERP suite of software or be used for the development of neural ERPs in the near future.
REFERENCES
[1] Ziarati, M. and Ucan, O.N., “Optimisation of Economic Order Quantity Using Neural Networks Approach”, Dogus University Journal Number, No: 3, pp.128-140, January 2001 [2] Wang, Q., “Improving the Cost Model Development Process Using Neural Networks”, Thesis, De Monfort University, November 2000 [3] Stockton, D.T., Quinn, L., “Identifying Economic Order Quantities Using Genetic Algorithms” International Journal of Operations and Production Management, V3, n11, 1993. [4] Ucan, O. et al., “Separation of Bouguer anomaly map using cellular neural network”, Journal of Applied Geophysics 46, pp.129-142 , 2001.
[5] Ziarati, R., Khataee, A., “Integrated Business Information System (IBIS) – A Quality Led Approach”, Keynote Address. SheMet 94, Belfast University Press, Ulster, UK, April 1994. [6] Ziarati, R., “Factories of the Future”, Invited paper, EUROTECNET Conference, Germany [7] Chua, L. O. and Yang, L., “Cellular Neural Networks: Theory”, IEEE Trans. Circuit and Systems, V35, pp.1257-1272, 1998.
[8] Kozek, T., Roska, T. and Chua, L. O., “Genetic Algorithms for CNN template Learning”, IEEE Trans. Circuit and Systems, V40, pp.392-402, 1988.
[9] Davis, L., “Handbook of Genetic Algorithms” New York: Van Nostrand Reinhold., 1991. [10] Holland, J. H., , “Outline for a logical theory of adaptive systems: J. Assoc.” Computer V3, pp.297-314, 1975.
[11] Holland, J. H., “Adaptation in neural and artificial systems” Ann Arbor, MI: University of the Michigan Press, 1975.
[12] A.Muhittin Albora, Atilla Ozmen, Osman N. Ucan,"Residual Separation of magnetic fields
using a Cellular Neural Network Approach", Pure Applied Geophysics, 158, pp. 1797-1818, Sept., 2001.
[13] A.Muhittin Albora, Osman N. Ucan, Atilla Ozmen, Tulay Ozkan, "Separation of Bouguer anomaly map using cellular neural network", Journal of Applied Geophysics, 46, pp.129-142, 2001.
[14] Adem Karahoca, Osman N. Ucan, Erkan Danacý,"Random Neural Network Approach in Distributed Database Management System", Journal of Electrical &Electronics, Vol.1, Number 1, pp,84-110, 2001.
[15] Osman N. Ucan, A. Özmen," Performance of Gray Scaled Images Using Segmented Cellular Neural Network Combined Trellis coded Quantization/Modulation (SCNN-CNN CTCQ/TCM) Approach over Rician Fading Channel", Dogus University Journal, pp.217- 224, January 2000.
[16] Osman N. Ucan, S. Seker and S. Paker, "Jitter Performance of Neural Network Equivalent MPSK Schemes Over Microwave Channels", International Journal of Communication Systems, Vol 11, pp. 169-178 May-June 1998.
[17] Osman N. Ucan, Murat Uysal and Atilla Ozmen ," Combined TCQ/TCM and Neural Network Modelling (In Turkish) " Electrical, Electronics and Computer Technologies Conf. Adana, pp.35, 1998.
[18] Osman N. Ucan, A. Özmen," Performance of Gray Scaled Images using Quantized Cellular Neural Network Combined Trellis coded Quantization/Modulation (QCNN-CNN CTCQ/TCM) Approach over Rician Fading Channel", International Conference on Telecommunications, June 15-18 Kore, 1999 [19] Osman N. Ucan, A. Özmen" Performance of Cellular Neural Network modeled trellis coded quantization/modulation signals at Rician channels," IEEE Signal processing and Applications , Turkey, 1999.
[20] Baran Tander, Osman N. Ucan," 3x3 stable cellular neural network model using PSPICE programming", Electrical Engineering Chamber , Gaziantep, 1999.
[21] Mukden Uður, Osman N. Ucan, Ayten Kuntman, Atilla Özmen, Ahmet Merev, " Analysing the 2-D surface tracking patterns by using cellular neural networks", IEEE Int. Power Conf., USA. 1999
TABLE:
Table 1. Input table (P) for training showing product quantities demanded by the dealers. First 3 weeks Second 3 weeks Third 3 three weeks
İTEM NO A B C D E F A B C D E F A B C D E F 1 9 7 6 0 13 6 11 12 10 0 15 11 11 7 10 0 15 5 2 10 0 0 0 0 0 12 0 0 0 0 0 6 0 0 0 0 0 3 41 4 0 0 0 0 44 5 0 0 0 0 40 4 0 0 0 0 4 67 0 0 0 0 17 63 0 0 0 0 16 64 0 0 0 0 17 5 57 40 6 0 5 17 57 42 8 0 6 14 46 38 6 0 8 5 6 21 0 0 0 0 0 22 0 0 0 0 0 21 0 0 0 0 0 7 72 54 8 0 8 8 71 60 10 0 9 9 90 56 8 0 8 10 8 30 0 0 0 0 0 32 0 0 0 0 0 27 0 0 0 0 0 9 0 1 0 0 0 0 0 2 0 0 0 0 0 2 0 0 0 0 10 11 0 0 0 0 0 12 0 0 0 0 0 11 0 0 0 0 0 11 29 14 4 0 6 6 31 21 3 0 7 9 29 16 4 0 11 8 12 0 0 7 4 0 7 0 0 11 4 0 8 0 0 6 0 6 6 13 48 0 36 0 0 0 50 0 46 0 0 0 48 0 36 0 0 0 14 51 0 0 0 0 0 50 0 0 0 0 0 51 0 0 0 0 0 15 150 12 0 0 24 10 170 19 0 0 26 11 156 14 0 0 24 10 16 0 40 0 0 13 26 0 41 0 0 14 28 0 40 0 0 13 26 17 0 0 0 0 500 0 0 0 0 0 600 0 0 0 0 0 550 0 18 5 0 0 0 0 0 6 0 0 0 0 0 5 0 0 0 0 0 19 13 0 0 0 0 0 14 0 0 0 0 0 14 0 0 0 0 0 20 72 0 0 0 0 0 76 0 0 0 0 0 90 0 0 0 0 0 21 13 0 0 0 0 0 14 0 0 0 0 0 13 0 0 0 0 0 22 0 31 0 3 1 3 0 32 0 4 2 4 0 29 0 3 1 6 23 0 0 0 0 16 0 0 0 0 20 0 0 0 0 0 20 0 0 24 4 0 0 0 0 0 5 0 0 0 0 0 8 0 0 0 0 0 25 0 81 0 0 0 0 0 78 0 0 0 0 0 79 0 0 0 0 26 30 19 0 0 0 0 32 21 0 0 0 0 30 23 0 0 0 0 27 0 17 0 0 0 0 0 18 0 0 0 0 0 26 0 0 0 0 28 0 48 0 0 0 23 0 52 0 0 0 25 0 46 0 0 0 23 29 0 0 9 0 0 0 0 0 10 0 0 0 0 0 12 0 0 0 30 0 0 0 0 0 3 0 0 0 0 0 4 0 0 0 0 0 6 31 14 0 0 0 0 0 28 0 0 0 0 0 28 0 0 0 0 0 32 25 0 0 0 0 0 30 0 0 0 0 0 30 0 0 0 0 0 33 20 0 0 0 0 0 30 0 0 0 0 0 30 0 0 0 0 0 34 48 0 0 0 0 0 72 0 0 0 0 0 54 0 0 0 0 0 35 0 11 0 0 0 0 0 13 0 0 0 0 0 12 0 0 0 0 36 36 0 0 0 0 0 34 0 0 0 0 0 24 0 0 0 0 0 37 0 0 0 2 0 0 0 0 0 5 0 0 0 0 0 3 0 0 38 0 0 0 0 1 0 0 0 0 0 2 0 0 0 0 0 2 0 39 0 16 0 0 0 0 0 18 0 0 0 0 0 14 0 0 0 0 40 0 14 0 0 0 0 0 16 0 0 0 0 0 12 0 0 0 0 41 0 0 36 0 0 0 0 0 30 0 0 0 0 0 42 0 0 0 42 0 0 0 30 0 0 0 0 0 35 0 0 0 0 35 0 0 0 43 0 0 0 0 80 0 0 0 0 0 80 0 0 0 0 0 90 0 44 0 0 0 0 0 10 0 0 0 0 0 15 0 0 0 0 0 15 45 56 0 0 0 28 0 70 0 0 0 42 0 42 0 0 0 28 0 46 0 1 0 0 0 0 0 2 0 0 0 0 0 2 0 0 0 0 47 0 0 0 0 0 10 0 0 0 0 0 12 0 0 0 0 0 11 48 0 0 0 0 0 10 0 0 0 0 0 12 0 0 0 0 0 12 49 0 0 0 0 0 10 0 0 0 0 0 9 0 0 0 0 0 14 50 0 0 0 0 0 10 0 0 0 0 0 10 0 0 0 0 0 8 51 0 0 0 0 0 10 0 0 0 0 0 11 0 0 0 0 0 8 52 0 0 0 0 0 11 0 0 0 0 0 12 0 0 0 0 0 8 53 0 17 0 0 0 0 0 18 0 0 0 0 0 16 0 0 0 0 54 0 24 0 0 0 0 0 22 0 0 0 0 0 28 0 0 0 0 55 0 0 15 0 0 0 0 0 20 0 0 0 0 0 20 0 0 0 56 0 0 0 0 0 18 0 0 0 0 0 20 0 0 0 0 0 22 57 21 0 0 0 0 0 19 0 0 0 0 0 22 0 0 0 0 0 58 14 0 0 0 0 0 16 0 0 0 0 0 28 0 0 0 0 0 59 14 0 0 0 0 0 15 0 0 0 0 0 12 0 0 0 0 0 60 10 0 0 0 0 0 12 0 0 0 0 0 8 0 0 0 0 0 61 13 0 0 0 0 0 15 0 0 0 0 0 16 0 0 0 0 0 62 13 0 0 0 0 0 16 0 0 0 0 0 16 0 0 0 0 0 63 19 0 0 0 0 0 21 0 0 0 0 0 17 0 0 0 0 0 64 65 0 0 0 0 0 71 0 0 0 0 0 52 0 0 0 0 0 65 7 0 0 0 0 0 8 0 0 0 0 0 11 0 0 0 0 0 66 15 0 0 0 0 0 13 0 0 0 0 0 17 0 0 0 0 0 67 19 0 0 0 0 0 17 0 0 0 0 0 21 0 0 0 0 0 68 0 10 0 0 0 0 0 9 0 0 0 0 0 8 0 0 0 0 69 0 1 0 0 0 0 0 2 0 0 0 0 0 2 0 0 0 0
FIGURES:
r=1 r=2
Figure 1. Representation of Neighbourhood Relation of CNN.
Σ
∫
y
u
x
∆
tx
x
y
Figure 2.CNN model input-output relationship.
- 1 - 1 1 - 1 x y = f( x ) 0
log (P+1) log (T+1) log(Y+1) INPUT DESIRED GCNN OUTPUT
log (PP+1) log (TT+1) log (YY+1)
INPUT DESIRED GCNN
OUTPUT Figure 5. GCNN Application for testing
Martin Ziarati was born in the city of Bath, UK and before commencing his degree
study was awarded a Year In Industry sponsorship. He graduated from Nottingham Trent University in 1995 and obtained an honours degree in Business Economics. He commenced his work for Birmingham Manufacturing Centre in 1996 sponsored by the European Union and published his report on competitiveness in September 1997. In 1997 he was appointed as a research assistant at Dogus University and later as a Specialist in the Computer Engineering Department. He concluded his MPhil studies at De Montfort University and is currently writing up his PhD thesis at the same university. He has published several papers in journals and presented his research findings at two recent IEEE conferences.
Professor Stockton is the Director of the Centre of Lean Engineering at De Montfort
University, UK and leads a flourishing research group which conducts high quality fundamental and applied research, within the disciplines of manufacturing engineering and operations management, that is innovative and relevant to the needs of global manufacturing industry. His current research interests are in the areas of value stream design, lean engineering, cost engineering and the design and operation of multi-component flexible manpower lines.