DOI 10.1007/s11135-013-9878-5
An empirical study on the nexus between the emotional
intelligence of top managers and their assessment
of intellectual capital
Evren Ayranci · Nurdan Çolako˘glu
Published online: 1 June 2013
© Springer Science+Business Media Dordrecht 2013
Abstract This study considers intellectual capital based on the assumption that this capital, which possesses social aspects, is related to the emotional capacities (i.e., emotional intelli-gence) of an organization’s members. A literature review indicates that this relationship has been previously noted and studied, and researchers agree that the emotional intelligence of the members of an organization affects the organization’s intellectual capital. Based on this analysis, this relationship is examined in the Turkish business context. Data are collected from top managers, who can affect the intellectual capital oftheir businesses and who, as human beings, are emotional. Thus, in this study, the emotional intelligence of top man-agers and their opinions regarding the intellectual capital of their businesses are considered to be related, with interesting results. When all of the factors of emotional intelligence that are likely to affect opinions regarding intellectual capital are examined using a multivariate model, the effect of emotional intelligence is revealed. Primarily, three factors of the emotional intelligence—empathy and communication skill, self-awareness and sociability—affect the participants’ opinions regarding the intellectual capital of their businesses. Univariate models are used to evaluate the effect of each emotional intelligence factor on the participants’ opin-ions regarding the intellectual capitalof their businesses. Empathy and communication skills affect opinions about the quality of human capital. Self-awareness affects opinions about the organizational commitment of workers. Sociability can affect opinions about information technology and information sharing. In summary, emotional intelligence affects opinions about human capital quality, information technology and information sharing.
Keywords Intellectual capital· Emotional intelligence · Human capital · Top manager · Turkey
E. Ayranci (
B
)· N. Çolako˘gluFaculty of Economics and Administrative Sciences, Business Administration (in English) Department, Istanbul AREL University, Istanbul, Turkey
e-mail: [email protected]; [email protected] N. Çolako˘glu
1 Introduction
In today’s business world, subjects such as the new economy, the service economy, innovation, process management and quality assurance are widely discussed. These subjects and many others, including global competition and the ever-changing circumstances of the business environment, influence managerial decisions and make it challenging to operate a business efficiently.
The foundation that all of these subjects share is business intelligence (Hameed 2004), which may be understood as the fuel that the decision-maker requires. The literature posits that this fuel is refined by the use of knowledge management, which is the systematic process of selecting, assessing and presenting business-related information (Hameed 2004). This connection between business intelligence and knowledge management has been noted by many scholars (McKnight 2002;Haimila 2001).
There are several commonalities between these two ideas, such as data, data mining and
text mining (Cook and Cook 2000). If these commonalities are examined, core concepts such as data, information and knowledge emerge, and it is widely held that most of these core concepts comprise the ingredients of intellectual capital (Marco 2002). Together, these core concepts form the basic motivation for this study.
The analysis of intellectual capital reveals that some of its components, such as customer capital, are generally outwardly directed, whereas others, such as structural and human cap-ital, are directed toward the internal environment (Bontis 1998). This assessment suggests that intellectual capital is important for business-related information and the evaluation of that information. In addition, unlike knowledge management, intellectual capital does not depend strongly on quantitative data), although most business-related information is qual-itative (Cook and Cook 2000). Moreover, intellectual capital has advantages over business intelligence, which represents a picture of the reality that may have lost content in its com-position (Kurtyka 2003).
In addition, certain factors reflect human nature and social relationships, that is, the human-istic aspects of intellectual capital. This humanity implies the following possibility: the emo-tionality of individuals in the work context may relate to the intellectual capital of a business. Humans are emotional beings, and thus emotionality may be observed in work contexts.
Unfortunately, only a small number of studies considering intellectual capital include an examination of human emotionality in the business environment. Thus, a significant contri-bution of this study is that it considers whether there is a relationship between the emotional capacity of an organization’s members and their opinions regarding the intellectual capital of their businesses. Emotional capacity is referred to as emotional intelligence in the literature. The authors of the present study have determined that it would be appropriate to consider top managers as organizational members because the top managers control the entire company, including its intellectual capital, and because they are human beings who should possess emotions. Therefore, certain relationships may be revealed using data collected from such individuals.
This study aims to identify the possible relationships between the emotional capacities of Turkish top managers (i.e., their emotional intelligence) and their opinions about the intellectual capital of their businesses. More precisely, the authors first intend to understand the factors on which the emotional intelligence of top managers depend and the factors that influence their opinions regarding the intellectual capital of their businesses. Second, the study proceeds based on evidence from the literature (Man et al. 2002;Jerico 2001;Gratton
and Ghoshal 2003;Badura 2000) that the emotional capacities of organizational members
intellectual capital by preceding it (Gendron 2004;Coleman 1994). This second step is operationalized with emotional intelligence as an independent variable and by employing a general linear model to analyze the effect of emotional intelligence on the opinions of top managers regarding the intellectual capital of their businesses.
2 Emotional intelligence: definitions, contents and measurement
According to the literature, emotional intelligence was first used by Payne (1985), who asserted that emotional intelligence is the ability of a person to relate to fear, pain and ambition. This definition appears to be limited to a few emotions. However, a more gen-eral definition was presented bySalovey and Mayer(1990). These scholars briefly defined emotional intelligence as the ability of a person to analyze his or her own emotions and those of others and to use these analyses, to a certain extent, to accomplish private purposes. Salovey and Mayer’s (1990) study, which uses a broad approach, is known as the four branch
model, which implies that emotional intelligence is composed of four capacities: to perceive
emotions, to decode emotional meanings, to use emotions to enrich one’s thoughts and to direct emotions for specific purposes. AfterSalovey and Mayer(1990), other scholars stud-ied emotional intelligence. For example, another model of emotional intelligence, suggested
byGoleman(1995), includes five factors: understanding one’s own emotions, maintaining
successful social relationships, entering into specific social states willingly to be success-ful, understanding and affecting other people’s emotions and directing one’s own emotions.
Davies et al.(1998) contended that emotional intelligence is composed of psychological
processes that are interconnected and can be divided into three aspects: the assessment of one’s own emotions and those of others verbally or in another manner, the use of emo-tions to contribute to the thinking process and regulating one’s emoemo-tions. A study similar to
Salovey and Mayer(1990) was conducted byJordan et al.(2002), who considered emotional
intelligence to be a combination of three factors: directing one’s emotions, caring about the emotions of others and using emotions to solve problems.
Certain studies have focused on specific aspects of emotional intelligence. Some scholars (Nowicki and Duke 1994;Matsumoto et al. 2000;Elfenbein et al. 2006) have argued that emotional intelligence depends primarily on the skill and capacity of emotional perception, whereas other scholars, such as Averill and Nunley(1992), Parrott (2002) andRichards
et al.(1992), focused on the role of emotions in the thinking process. By contrast,
Innes-Ker and Niedenthal(2002),Lane et al.(1990) andMacCann et al.(2004) asserted that the
capacity to successfully match specific emotions and specific conditions forms the basis of emotional intelligence. Finally,Eisenberg(2000) andDenham et al.(2003) claimed that the most important factor in emotional intelligence is emotional management capacity.
A similar variety of definitions and aspects of emotional intelligence appears in the various instruments used to measure emotional intelligence. One measurement method is the mul-tifactor emotional intelligence scale (MEIS), which was developed byMayer et al.(2000). This method was criticized byConte (2005) andVan Rooy and Viswesvaran (2004) for low reliability, resulting in the creation of an improved scale: the Mayer–Salovey–Caruso emotional intelligence test (MSCEIT) (Mayer et al. 2002). Another prominent instrument is the emotional quotient inventory (EQ-i) developed byBar-On(1997), which includes five subscales: intrapersonal, interpersonal, stress management, adaptability and general mood.
Cooper(1997) incorporates social threats and satisfaction, the awareness of one’s own
emo-tions and those of others, creativity, passion, personal emotional power, the general health condition and quality of life in the method known as the Emotional Quotient Map. In
addi-tion, the emotional competence inventory ofBoyatzis et al.(2000) considers factors such as self-awareness, social capabilities, social awareness and self-management. Similar to defini-tions that focus only on certain aspects of emotional intelligence, several instruments consider only specific aspects of emotional intelligence. The diagnostic analysis of nonverbal accuracy scale (DANVA) (Nowicki and Duke 1994) and the Japanese and caucasian brief recognition test (JACBART) (Matsumoto et al. 2000) are two examples of such instruments.
Because this study considers managers in the Turkish business context, it is appropriate to reference several studies on the emotional intelligence of Turkish managers. Notable, many current studies focus on the emotional intelligence of workers (Kalyoncu et al. 2012; Akbolat and Isik 2012). However, fewer studies primarily address the emotional intelligence of managers (Yan 2008;Titrek et al. 2009;Pamukoglu 2004;Ozdemir and Ozdemir 2007;
Cengiz et al. 2006;Cakar and Arbak 2003;Ayranci 2010;Acar 2002).
The relevant Turkish studies generally concern specific issues, such as organizational performance, conflict management, management effectiveness and leadership. The emo-tional intelligence of managers has been found to be effective in conflict management; man-agers who exhibit greater emotional intelligence can foster a positive emotional atmosphere (Ozdemir and Ozdemir 2007). Moreover, emotional intelligence is a vital factor for man-agement effectiveness (Yan 2008;Pamukoglu 2004), contributes to the creativity of the organizational leader and can be used to increase worker creativity (Cengiz et al. 2006). Furthermore, emotional intelligence contributes to positive behavior by leaders toward fol-lowers (Acar 2002), and there is a close relationship between transformational leadership and emotional intelligence (Cakar and Arbak 2003). In addition, the demographic characteristics of managers are a primary factor in their inabilities to regulate their emotions (Titrek et al. 2009), and the emotional and spiritual intelligence of managers relates to their perceptions of the financial performance of their organizations (Ayranci 2010).
3 Intellectual capital: definitions, components and measurement
In the two decades that intellectual capitalhas received attention in the literature, many dif-ferent definitions have been established. Intangible or unseen are common features of these definitions. Typically, intellectual capital is defined as the knowledge ownership, experience, organizational technology, customer relationships and professional capabilities that foster competitiveness (Edvinsson and Malone 1997). In addition, intellectual capital includes the sum of all of the unseen assets that increase an organization’s current and future profitability (Ordonez de Pablos 2002) and the knowledge, intellectual properties and experience that may contribute to the wealth of organizations (Stewart 1997). Moreover, intellectual capital is the sum of intangible assets that promote the continuation of organizational operations (Brooking 1996).
It is remarkable that all of these definitions describe the content of intellectual capital. For example,Bontis(1998) claims that intellectual capital possesses three components:
struc-tural capital (organizational work processes and policies), human capital (the intelligence,
knowledge and experience of workers) and customer capital (the potential interests derived from relationships with customers and other groups who reside in the organization’s external environment). In greater detail,Brooking(1996) posits that intellectual capital possesses four components: intellectual property assets (e.g., patents, copyrights and commercial secrets), market assets (e.g., customers, customer loyalty, license and cooperation agreements and part-nerships), human-centered assets (the education, competency, knowledge and experience of workers) and infrastructural assets (e.g., organizational culture, management philosophy and
technology). Similar toBontis(1998),Stewart(1997) considers intellectual capital a com-bination of human, structural and customer capital, whereasEdvinsson and Malone(1997) consider only human and structural capital.
Similar to emotional intelligence, intellectual capital is either fully and or partially focused on by different scholars. Some studies only consider human capital (O’Donnell et al. 2003; Choo and Bontis 2002), structural capital (Roos and Roos 1997) and customer (relational) capital (Prahalad and Ramaswamy 2000;Bontis 2002). Other scholars consider the legal aspects of intellectual capital. An example isHarrison and Sullivan(2000), who start with human capital (the tacit knowledge of workers) and then analyze human capital to reveal
intellectual assets. When intellectual assets possess legal dimensions, intellectual properties
emerge.
In addition to the emotions of an organization’s members, for this study, the human dimension of intellectual capital is important. The literature agrees with this importance, and certain scholars, such asBackhuijs et al.(1999),Bontis(1998),Bontis and Fitz-Enz(2002),
Gratton and Ghoshal(2003) andJohanson et al.(1999), contend that human capital is the
most important component of intellectual capital.
Turkish studies are primarily concerned with the measurement of intellectual capital in work contexts (Kanibir 2004;Bozbura and Toraman 2004; Ayzit 2006; Arikboga 2003;
Akyuz 2005;Akdemir 1998;Akbay 2007). Most of these studies conclude that prioritizing
intellectual capital or considering intellectual capital in an organizational context benefits an organization’s value, performance and competitive power. In addition, the Turkish liter-ature has started to precisely report intellectual capital according to Turkish accounting and reporting principles (Yereli and Gersil 2005;Sipahi 2004;Erhan 2003), and certain recent studies (Demir and Bahadir 2007;Ceran 2007) consider the overlap of International Financial Reporting Standards (IFRS) with intellectual capital reporting in Turkey.
4 Relating intellectual capital and emotionality
Notably, many intellectual capital studies do not consider worker emotions, values or commit-ment as sub-capital, although these phenomena may affect workers and thus human capital. However, certain studies consider these intangible subjects to be part of intellectual capital. Two such studies areGubman(1998) andMayo(2001), which emphasize the management of the organizational commitment and the emotions of workers toward the organization as if these matters belonged to the organization’s intangibles. From a similar perspective,Jerico (2001) contends that organizational abilities strongly depend on the organization’s work-ers and that this dependency is closely related to the competencies and commitment of the workers. In a more direct approach,Ulrich(1998) claims that intellectual capital is formed by organizational competencies, and the emotional and professional commitment of work-ers. Similarly,Man et al.(2002) include personal emotions, values and attitudes among the competencies and commitment of workers.
All of these studies imply that emotionality is primarily related to human or intellectual capital rather than regarding emotionality as a specific sub-component of human capital or intellectual capital itself.
Other studies focus on the emotionality-human capital relationship. For example,Badura (2000) notes that emotionality (in the form of satisfaction or dissatisfaction, fear or commit-ment) can affect human capital’s effectiveness.Davenport(1999) goes further by asserting that the desire of workers to emotionally bond with the organization is the primary moti-vation of human capital investment.Litschka et al.(2006) consider human capital to be the
services of the workers for the organization, that is, human performance for the sake of the organization. These researchers define this performance as the product of the abilities and motivation of workers in addition to their satisfaction and commitment.Tran (1998) presents the formation, evolution and consequences of the emotional climate in learning organizations, concluding that this climate affects organization-level learning ability but that the experiences, knowledge and skills of workers act with the emotional climate to alter this learning ability.
A minority of scholars insist that emotionality should be thought of as a capital. For example,Gratton and Ghoshal(2003) accept human and social (relational) capital. However, these researchers consider that the third component of intellectual capital is emotional capital, that is, the ability to understand one’s own emotions and those of others, to be sincere with respect to one’s emotions and to act with will and hope.Gendron(2004) represents an advance
onGratton and Ghoshal(2003) in that the author considers emotional capital and relates it
to other capital types. The relation reveals that emotional capital is a vital premise for human capital development and knowledge management.
An earlier study byColeman(1994) asserts that emotional capital is relevant to social and human capital and thus may become a main ingredient of human capital. Similarly,Goleman (1998) notes that emotional capital is the set of emotional competencies that is learned from social context and religion and represents a supra-system, including human capital, that is not limited to the work context.
5 Method
The research aims to clarify the effects of the emotional capacities of Turkish top managers on their opinions regarding the intellectual capital of their businesses. To this end, the authors select a sample that includes the managers of businesses in the Ikitelli Organized Industrial Zone in Istanbul, Turkey. The sample is designed to include only one participant from each business, the top manager. There are more than 27,300 businesses in this zone (Ikitelli Orga-nized Industrial Zone 2012), and with a 5 % margin of error and a 95 % confidence level, the sample size is calculated to be 374. Simple random sampling of 400 participants is used to compensate for missing or invalid data. At the end of the data-collection process, 363 valid cases remain.
Opinions about intellectual capital depend on the items presented inBontis(1998). Emo-tional capacities (i.e., emoEmo-tional intelligence) are measured using the items of Bar-On’s (2002) emotional quotient inventory short version (EQ-i: S). Rewordings were performed for the Turkish language. Because of the length of the questionnaires and the aim of the research, the demographic characteristics of the participants were not collected.
5.1 Statistical structures and reliability of emotional intelligence and opinions about intellectual capital
The authors first perform confirmatory factor analyses on the emotional intelligence data and the opinions about intellectual capital. The results indicate that the original structures, as posited byBar-On(2002) andBontis(1998), are not valid for the sample, leading to the explanatory factor and reliability analyses.
The explanatory factor analysis of the emotional intelligence data is performed using principal components analysis with the extraction of the factors with eigenvalues larger than one, varimax rotation and the suppression of items with factor loadings smaller than
|0, 5|. The missing values are replaced with mean values. In total, 47 items remain to form the factors. The rest are omitted for several reasons. Certain factors are formed by only two items, which is undesirable (Norman and Streiner 2008), and certain items cannot be grouped under any factor. Before omission, the Kaiser–Meyer–Olkin (KMO) value is 0.637, and the Bartlett’s test value is significant, which indicates that the data are fairly suitable to be factorized. A total of 28 factors emerge that can explain 68.819 % of the total variance. After the omissions are performed, the KMO increases to 0.720 with a significant Bartlett test value. The remaining 47 items are grouped under nine factors that can explain 61.755 % of the total variance. Table1includes the results of the explanatory factor analysis of the emotional intelligence items and the reliability analysis results.
The explanatory factor analysis of the data on opinions regarding intellectual capital demonstrates that these data are more suitable to factorization than the emotional intelligence data (a KMO value of 0.810 compared with 0.637). Omissions are performed, which again leaves, surprisingly but coincidentally, 47 items. Before omissions, a total of 18 factors account for 72.549 % of the total variance. The omissions lead to the extraction of 7 factors that account for 69.618 % of the total variance. The omissions also cause the KMO value to increase to 0.849 with a significant Bartlett’s test value. Table2 shows the results of the explanatory factor and reliability analyses of the top managers’ opinions about their businesses’ intellectual capital.
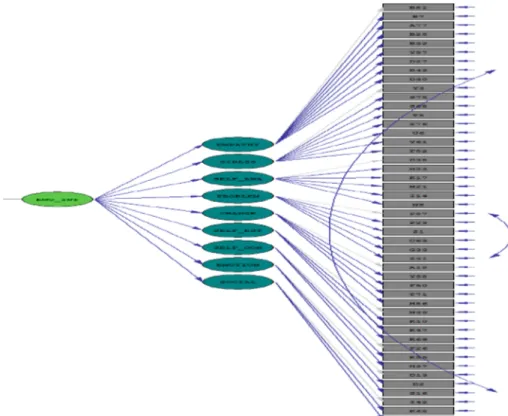
5.2 The proposed model for emotional intelligence
In accordance with the study’s goal, the authors performed second-level factor modeling using structural equation modeling (SEM). The items used were adopted fromBar-On(2002), and from these items, nine factors emerged. Although all of these factors are related to emotional intelligence, the authors question whether the nine factors can be aggregated under the title of
emotional intelligence. The proposed model, with the optimization suggestions of LISREL
applied, is presented in Fig.1.
The evaluation of the model in Fig.1indicates that the model is realistic overall, with foremost fit indices within the limits suggested by the literature (Schermelleh-Engel and
Moosbrugger 2003;Hooper et al. 2008). Table3shows the fit indices of the model in Fig.1.
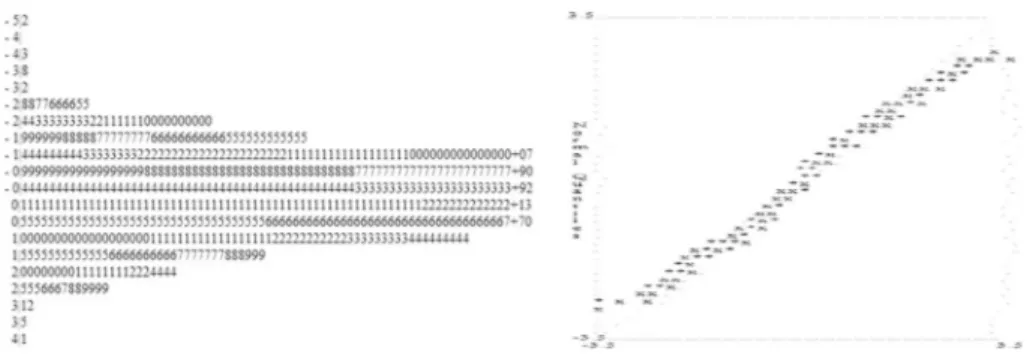
In addition, the model’s standardized residuals were considered for further evaluation. Both the stemleaf and Q–Q plots of the model’s standardized residuals (Fig.2) suggest that the model is realistic overall.
In addition, this realistic model is valid in terms of all relationships, the error variances and the added error covariances according to LISREL’s suggestions on statistical significance. Table4shows the structural equations for the model.
Tables3and4and Fig.2demonstrate that the proposed model for emotional intelligence is realistic; therefore, the nine factors extracted from the explanatory analysis (Table1) can be statistically aggregated under the idea of emotional intelligence. Unfortunately, the struc-tural equations in Table4imply weak relationships between the nine factors and emotional intelligence.
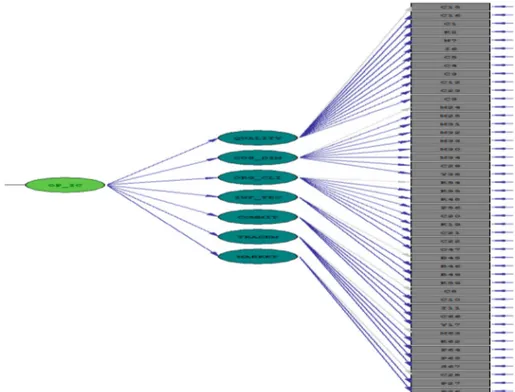
5.3 The proposed model for opinions regarding intellectual capital
In this section, we introduce the modeling of the opinions of the top managers regarding the intellectual capital of their businesses (Fig.3). This model requires no omissions, and the LISREL suggestions further increase the model’s accuracy. Therefore, one can conclude that
Ta b le 1 Explanatory factor and reliability analyses results for the emotional intelligence items Empathy and communication skill Item F actor loading Stress management Item F actor loading V ariance explained: 12.131 % I easily notice the emotional needs o f o thers 0.923 V ariance explained: 10.161 % I can endure intensi v e stress 0.838 When I d o not agree w ith someone, I can tell this fact to him o r h er 0.891 I can cope with stress without becoming angry 0.837 I can realize when someone is suf fering 0.853 I kno w h o w to remain calm in dif fi cult circumstances 0.777 I understand the emotions of others well, ev en if the y do not express the emotions directly 0.847 Despite the d if ficulties that occasionally emer ge, I usually belie v e that things will be better 0.773 F actor C ronbach’ s alpha v alue: 0.909 I form good relationships with others 0.813 F actor C ronbach’ s alpha v alue: 0.898 I b elie v e that I can cope with dif fi cult situations 0.764 Close relationships are v ital for m y friends and m e 0.720 It is easy for me to cope with disagreeable ev ents 0.764 I can easily tell others what I think 0.706 It is easy for me to adapt to n ew circumstances 0.680 I care w hat h appens to others 0.704 I try to see m atters realistically without fa ntasies or dreams 0.598 I am careful not to hurt the feelings of others 0.624 Self-a w areness Item F actor loading Problem-solving Item F actor loading V ariance explained: 8 .174 % It is easy for me to define m y emotions 0.948 V ariance explained: 6 .531 % W hen I face a p roblem, I first stop and think 0.801 I kno w w hat I feel 0.879 When I solv e a p roblem, I analyze ev ery possibility and then determine the b est approach 0.790 I kno w w hich tasks I am good at 0.830 My approach to dif fi culties is to adv ance step by step 0.670 F actor C ronbach’ s alpha v alue: 0.843 I h av e d etermined life goals 0.735 F actor C ronbach’ s alpha v alue: 0.800 I kno w h o w to address anno y ing problems 0.667
Ta b le 1 continued Self-a w areness Item F actor loading Problem-solving Item F actor loading I feel positi v e when I examine my good or bad aspects 0.677 When I face dif fi cult circumstances, I w ant to collect as much information as possible 0.650 I kno w w hat upsets me when I feel bad 0.606 Ev en when matters b ecome increasingly d if ficult, I g enerally ha v e the m oti v ation to continue 0.577 Openness to change Item F actor loading Self-esteem Item F actor loading V ariance explained: 6.444 % I can change my habits easily 0.811 V ariance explained: 5.872 % I can defend my rights 0 .862 It is easy for me to start n ew things 0.796 I am self-confident under m ost circumstances 0.846 It is easy for me to change my ideas re garding an y subject 0.787 I can mak e my o w n d ecisions 0.817 F actor C ronbach’ s alpha v alue: 0.816 It is easy to change my style 0 .734 F actor C ronbach’ s alpha v alue: 0.835 I appreciate myself 0.668 It is easy for me to say “no” 0.590 Self-contentment Item F actor loading Emotion p resentation skill Item F actor loading V ariance explained: 4.602 % I am h app y with my physical appearance 0.856 V ariance explained: 4 .267 % I can easily share d eep emotions with others 0.770 I am h app y with my personality 0.795 It is easy for me to display my emotions 0.761 F actor C ronbach’ s alpha v alue: 0.768 I enjo y life 0 .771 F actor C ronbach’ s alpha v alue: 0.664 I am g enerous with my lo v e 0.735 Sociability Item F actor loading V ariance explained: 3.573 % Others think that I am sociable 0.741 I can mak e friends easily 0.715 F actor C ronbach’ s alpha v alue: 0.521 I enjo y helping o thers 0 .644
Ta b le 2 Explanatory factor and reliability analyses results for opinions about intellectual capital Human capital: the quality of human capital Item F actor loading Customer capital: customer dimension Item F actor loading V ariance explained: 17.080 % Our emplo yees are skillful and creati v e 0. 926 V ariance explained: 16.513 % Our customers are g enerally pleased with our institution 0. 966 The d ev elopment o f the skills and creati vity of our emplo y ees is constantly supported 0. 919 Our p riority in customer relationships is to pro v ide customer satisf action 0. 961 Our emplo yees possess suf fi cient job experience 0. 914 W e try to solv e our customers’ problems rapidly 0. 940 Our tenured emplo y ees exhibit high job p erformance 0. 906 W e al w ays cooperate with our customers to satisfy their needs 0. 935 The sudden resignation o f our qualified and educated emplo y ees af fects our institution 0. 871 W e ha v e relationships with our customers that last long years 0. 923 The uni v ersity from w hich our emplo y ment candidates graduated is an important h iring criterion 0. 834 W e are constantly in contact with our customers 0. 913 F actor C ronbach’ s alpha v alue: 0.943 The m aster’ s de grees or PhDs of our emplo y ees increase their contrib u tions to our institution 0. 809 F actor C ronbach’ s alpha v alue: 0.978 Our customers are m ore lo y al to us than those o f our competitors 0. 902 W e support the education and skill de v elopment o f our emplo y ees 0. 801 Man y of our w o rk ers kno w our customer profile 0. 897 The education cost p er emplo y ee is systematically increasing 0. 732 W e are increasing our b u siness with our foreign customers 0. 866 Our emplo yees al w ays perform as well as possible 0. 704 Our emplo yees tak e appropriate risks to b e successful in their tasks 0. 670 W e pro v ide our emplo y ees with social moti v ational b enefits (e.g., health insurance, free m eals and pri v ate educational courses) 0. 618
Ta b le 2 continued Human capital: shared or ganizational climate Item F actor loading Structural capital: information technology and information sharing Item F actor loading V ariance explained: 10.696 % In our institution, there are relationships between emplo y ees and m anagers that d epend o n sharing and cooperation 0. 791 V ariance explained: 7.722 % Our institution in v ests continuously and increasingly in the information technology substructure (e.g., computers, the Internet, the Intranet and d atabases) 0. 955 There is a participati v e management understanding in our institution 0. 791 Our information technology substructure (e.g., computers, the Internet, the Intranet and d atabases) facilitates information sharing w ithin our institution 0. 944 Our corporate culture is supporti v e and m oti v ational 0. 775 F actor C ronbach’ s alpha v alue: 0.959 There are processes and systems present to share information in our institution 0. 943 There are mission, vision and corporate v alues that are accepted and shared b y institution’ s emplo y ees 0. 767 Our institution adapts to technological adv ancements rapidly 0. 918 Our emplo yees are w illing to share information among themselv es 0. 766 F actor C ronbach’ s alpha v alue: 0.906 The interpersonal relationships in our institution are good 0. 719 Our emplo yees are aw are of w o rking as a team 0. 694 W e encourage emplo yee teamw o rk 0. 694 The w ork atmosphere in our institution is positi v e 0. 642
Ta b le 2 continued Human capital: or ganizational commitment o f w ork ers Item F actor loading Customer capital: trademark d imension Item F actor loading V ariance explained: 6.995 % The commitment o f our emplo y ees to our institution is strong 0. 957 V ariance explained: 6.584 % A w idely recognized trademark is one of our most important institutional goals 0. 869 Our w ork ers are p leased to be emplo y ed at our institution 0. 879 Our institution’ s p roducts are recognized as a trademark in the mark et 0. 860 One o f the most important goals of our human resources polic y is emplo y ee satisf action 0. 853 W e patent o r cop yright the p roducts that belong to our institution 0. 762 F actor C ronbach’ s alpha v alue: 0.812 W e support the indi vidual contrib u tions of our emplo y ees to w ard our institution’ s goals 0. 659 F actor C ronbach’ s alpha v alue: 0.844 W e monitor the protection o f the patents or cop y rights o f our institution’ s p roducts 0. 686 Our m anagers are successful at directing the emplo y ees to w ard institutional goals 0. 596 Our institution is p rominent and w ell kno wn in the sector 0. 609 Customer capital: mark et dimension Item F actor loading V ariance explained: 4.028 % Man y of our institution’ s emplo yees kno w our mark et tar gets 0. 799 F o r the last fe w years, our mark et share h as been steadily increasing 0. 749 F actor C ronbach’ s alpha v alue: 0.646 Our institution tries to accomplish mark et tar gets in all of its operations 0. 679
Fig. 1 The proposed model for emotional intelligence. EMO_INT: Emotional intelligence, EMPATHY:
Empathy and communication skills, STRESS: Stressmanagement, SELF_AWA: Self-awareness, PROBLEM: Problem-solving, CHANGE: Openness to change, SELF_EST: Self-esteem, SELF_CON: Self-contentment, EMOTION: Emotion presentation skill, SOCIAL: Sociability
Table 3 Fit indices of the
proposed model for emotional intelligence
Fit indices Fit indices value
Expected cross-validation index (The index value is 6.23 for the saturated model and 38.49 for the independence model)
7.09
Root mean square error of approximation 0.060
Comparative fit index 1.00
Normed fit index 0.93
Non-normed fit index 1.00
Parsimony normed fit index 0.88
Incremental fit index 1.00
Relative fit index 0.92
Goodness of fit index 0.95
Adjusted goodness of fit index 0.95 Parsimony goodness of fit index 0.86
Fig. 2 The stemleaf and Q–Q plots of the standardized residuals of the proposed model for emotional
intel-ligence
Table 4 Structural equations of
the proposed model for emotional intelligence
See the footnote to Fig.1for the definitions of the abbreviations
EMPATHY= −0.043*EMO_INT, Errorvar. = 1.00, R2= 0.0018 (0.019) (0.059)
−2.26 16.88
STRESS= 0.40*EMO_INT, Errorvar. = 0.84, R2= 0.16 (0.039) (0.060)
10.17 14.04
SELF_AWA= 0.30*EMO_INT, Errorvar. = 0.91, R2= 0.089 (0.028) (0.063)
10.79 14.42
PROBLEM= − 0.44*EMO_INT, Errorvar. = 0.80, R2= 0.20 (0.025) (0.034)
−17.59 23.78
CHANGE= 0.10*EMO_INT, Errorvar. = 0.99, R2= 0.011 (0.023) (0.064)
4.59 15.51
SELF_EST= −0.37*EMO_INT, Errorvar. = 0.87, R2= 0.13 (0.028) (0.051)
−13.04 17.11
SELF_CON= 0.070*EMO_INT, Errorvar. = 1.00, R2= 0.0048 (0.023) (0.090)
3.05 11.08
EMOTION= 0.059*EMO_INT, Errorvar. = 1.00, R2= 0.0035 (0.027) (0.063)
2.21 15.82
SOCIAL= 0.039*EMO_INT, Errorvar. = 1.00, R2= 0.0015 (0.020) (0.070)
1.97 14.21
the factors for the opinions regarding intellectual capital are more readily modeled than those for emotional intelligence.
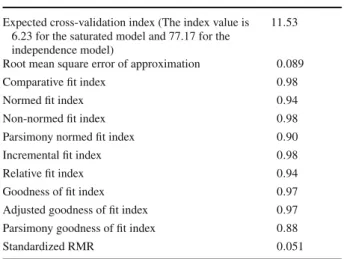
Table5clearly shows that the model for opinions about intellectual capital is realistic, and therefore details regarding the relationships can be presented.
Fig. 3 The proposed model for opinions regarding intellectual capital. OP_IC: Opinions regarding
intellec-tual capital, QUALITY: Human Capital: the quality of human capital, CUS_DIM: Customer capital: customer dimension, ORG_CLI: Human capital: shared organizational climate, INF_TEC: Structural capital: informa-tion technology and informainforma-tion sharing, COMMIT: Human Capital: Worker organizainforma-tional commitment, TRADEM: Customer capital: trademark dimension, MARKET: Customer capital: market dimension
An analysis of the standardized residuals for the model also demonstrates that the model is realistic. The stemleaf and Q–Q plots of the model’s standardized residuals are shown in Fig.4.
All of the relationships in the model are statistically significant, and Table6includes the structural equations. Nevertheless, most relationships are weak (Table6).
The findings demonstrate that the opinions of top managers regarding the intellectual capital of their businesses depend on seven factors. A remarkable result is that all seven factors can be grouped within the second-level latent variable (opinions regarding intellectual capital), albeit weakly.
5.4 The effect of the emotional intelligence of top managers on their opinions about the intellectual capital of their businesses
As previously mentioned, certain scholars (Davenport 1999;Badura 2000) assert that emo-tionality is relevant to human capital, whereas others (Gratton and Ghoshal 2003;Gendron 2004) consider emotional capital to be a component of intellectual capital. In short, emotion-ality is claimed to be linked with intellectual capital. This study focuses on this claim and analyzes the statistical structures of emotional intelligence and opinions regarding intellec-tual capital. The explanatory factor and the SEM analyses demonstrate that the emotional
proposed model for opinions regarding intellectual capital
Fit indices Fit indices value
Expected cross-validation index (The index value is 6.23 for the saturated model and 77.17 for the independence model)
11.53
Root mean square error of approximation 0.089
Comparative fit index 0.98
Normed fit index 0.94
Non-normed fit index 0.98
Parsimony normed fit index 0.90
Incremental fit index 0.98
Relative fit index 0.94
Goodness of fit index 0.97
Adjusted goodness of fit index 0.97 Parsimony goodness of fit index 0.88
Standardized RMR 0.051
Fig. 4 The stemleaf and Q–Q plots of the standardized residuals of the proposed model for opinions regarding
intellectual capital
intelligence of the participants is composed of nine factors, whereas the opinions of the par-ticipants regarding the intellectual capital of their businesses are composed of seven factors. All of the factors can be grouped under their respective second-level latent variable.
Next, the general linear model (GLM) is used to investigate the effect of emotional intel-ligence on the opinions regarding intellectual capital. Table7shows the results of the multi-variate model. The multimulti-variate model is built by taking main effects into consideration. The Box’s test of equality of covariance matrices can not be computed because there are fewer than two nonsingular cell covariance matrices and is ignored as advised byCardinal and
Aitken(2006).
Table7assumes that all of the factors of emotional intelligence affect opinions regard-ing intellectual capital. Accordregard-ing to Table7, the empathy and communication skills, self-awareness and sociability of the top managersaffect their opinions regarding the intellectual capital of their businesses. The partial eta squared values suggest that, among these three factors, the self-awareness of the top managers is the factor that is the most closely related to their opinions regarding intellectual capital, followed by their empathy and communication skills and, finally, their sociability.
Table 6 Structural equations of
the proposed model for opinions regarding intellectual capital
See the footnote to Fig.3for the definitions of the abbreviations
QUALITY= 0.11*OP_IC, Errorvar. = 0.99, R2= 0.012 (0.012) (0.046)
9.02 21.26
CUS_DIM= 0.30*OP_IC, Errorvar. = 0.91, R2= 0.091 (0.018) (0.045)
17.14 20.14
ORG_CLI= 0.25*OP_IC, Errorvar. = 0.94, R2= 0.060 (0.016) (0.041)
15.20 23.13
INF_TEC= 0.086*OP_IC, Errorvar. = 0.99, R2= 0.0074 (0.016) (0.073)
5.25 13.66
COMMIT= 0.045*OP_IC, Errorvar. = 1.00, R2= 0.0020 (0.016) (0.086)
2.74 11.61
TRADEM= 0.72*OP_IC, Errorvar. = 0.48, R2= 0.52 (0.041) (0.066)
17.53 7.22
MARKET= 0.21*OP_IC, Errorvar. = 0.95, R2= 0.046 (0.024) (0.078)
8.81 12.16
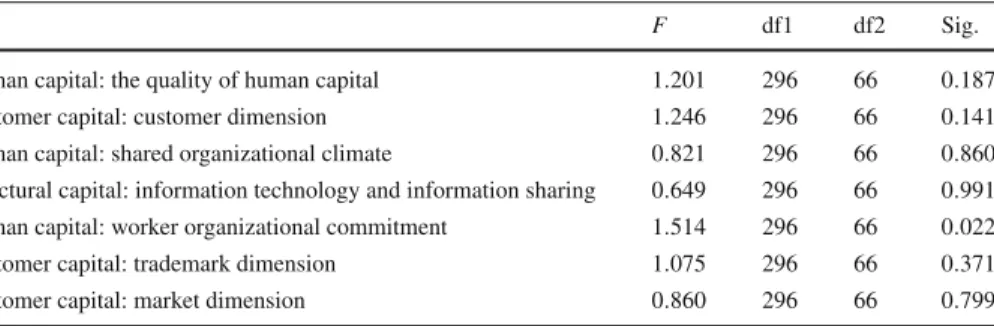
Next, the univariate tests are presented. In these tests, the aim was to determine how each factor contributing to top managers’ opinions regarding their businesses’ intellectual capital is affected by each factor of their emotional intelligence. The Levene test values for these effects are presented in Table8.
As Table8 indicates, only one factor of the opinions of top managers regarding the intellectual capitalof their businesses is not related to their emotional intelligence: Human
Capital: Workers’ organizational commitment. The study continues by examining the effects
of each emotional intelligence factor on each factor for the opinions regarding intellectual capital (Table9).
Each emotional intelligence factor of the top managers has been claimed to affect each factor of their opinions regarding the intellectual capital of their businesses (Table9). How-ever, there is little evidence to support these claims. The empathy and communication skills of the participants affect their opinions regarding the quality of the human capital of their businesses (sig.< 0.05; ∂η2 = 0.529). The self-awareness of the top managers can affect their opinions regarding worker organizational commitment (sig.< 0.05; ∂η2 = 0.732). Finally, the sociability of the participants can affect their opinions regarding information technology and information sharing related to their businesses. However, this relationship is weak (sig.< 0.05; ∂η2= 0.068).
From a broader perspective (see “Corrected Model”, Table9), the emotional intelligence of the top managers can affect their opinions regarding the quality of human capital in their businesses (sig.< 0.05, ∂η2 = 0.555 and adjusted R2 = 0.531) and their opinions regarding information technology and information sharing (sig.< 0.05, ∂η2 = 0.084 and adjusted R2= 0.033) but, unfortunately, not their opinions regarding worker organizational commitment because of the variance homogeneity problem revealed by Table8.
Ta b le 7 Results of the m ulti v ariate model for the ef fect of emotional intelligence factors on opinions re garding intellectual capital Multi v ariate tests d Ef fect V alue F Hypothesis d f E rror d f S ig. ∂η 2 Noncent. parameter Observ ed po wer b Intercept P illai’ s trace 0.882 359 .355 a 7.000 337.000 0.000 0.882 2515 .483 1.000 W ilks’ s lambda 0.118 359 .355 a 7000 337.000 0.000 0.882 2515 .483 1.000 Hotelling’ s trace 7.464 359 .355 a 7.000 337.000 0.000 0.882 2515 .483 1.000 Ro y’ s lar gest root 7.464 359 .355 a 7.000 337.000 0.000 0.882 2515 .483 1.000 Empathy and communication skill Pillai’ s trace 0.559 18.751 14.000 676.000 0.000 0.280 262 .518 1 .000 W ilks’ s lambda 0.452 23 .498 a 14.000 674.000 0.000 0.328 328 .969 1.000 Hotelling’ s trace 1.190 28.560 14.000 672.000 0.000 0.373 399 .837 1.000 Ro y’ s lar gest root 1.169 56 .452 c 7.000 338.000 0.000 0.539 395 .161 1.000 Stress management Pillai’ s trace 0.036 0.897 14.000 676.000 0.562 0.018 12 .563 0.583 W ilks’ s lambda 0.964 0. 896 a 14.000 674.000 0.563 0.018 12 .549 0.582 Hotelling’ s trace 0.037 0.895 14.000 672.000 0.564 0.018 12 .536 0 .582 Ro y’ s lar gest root 0.027 1. 311 c 7.000 338.000 0.244 0.026 9. 178 0.559 Self-a w areness Pillai’ s trace 0.739 28.314 14.000 676.000 0.000 0.370 396 .390 1 .000 W ilks’ s lambda 0.264 45 .561 a 14.000 674.000 0.000 0.486 637 .860 1.000 Hotelling’ s trace 2.776 66.628 14.000 672.000 0.000 0.581 932 .791 1.000 Ro y’ s lar gest root 2.772 133 .836 c 7.000 338.000 0.000 0.735 936 .852 1.000 Problem-solving Pillai’ s trace 0.019 0. 954 a 7.000 337.000 0.465 0.019 6. 680 0.412 W ilks’ s lambda 0.981 0. 954 a 7.000 337.000 0.465 0.019 6. 680 0.412 Hotelling’ s trace 0.020 0. 954 a 7.000 337.000 0.465 0.019 6. 680 0.412 Ro y’ s lar gest root 0.020 0. 954 a 7.000 337.000 0.465 0.019 6. 680 0.412 Openness to change Pillai’ s trace 0.042 1.034 14.000 676.000 0.417 0.021 14 .470 0 .662 W ilks’ s lambda 0.958 1. 032 a 14.000 674.000 0.419 0.021 14 .445 0.661 Hotelling’ s trace 0.043 1.030 14.000 672.000 0.421 0.021 14 .419 0.660
Ta b le 7 continued Multi v ariate tests d Ef fect V alue F Hypothesis d f E rror d f S ig. ∂η 2 Noncent. parameter Observ ed po wer b Ro y’ s lar gest root 0.029 1. 385 c 7. 000 338.000 0.210 0.028 9.698 0.587 Self-esteem Pillai’ s trace 0.039 0.640 21 .000 1017.000 0.891 0.013 13.431 0.529 W ilks’ s lambda 0.961 0.637 21 .000 968.232 0.893 0.013 12.797 0.503 Hotelling’ s trace 0.040 0.634 21 .000 1007.000 0.896 0.013 13.320 0.524 Ro y’ s lar gest root 0.019 0. 938 c 7. 000 339.000 0.477 0.019 6.566 0.405 Self-contentment P illai’ s trace 0.052 0.846 21 .000 1017.000 0.663 0.017 17.768 0.688 W ilks’ s lambda 0.949 0.845 21 .000 968.232 0.664 0.017 16.978 0.662 Hotelling’ s trace 0.053 0.844 21 .000 1007.000 0.666 0.017 17.723 0.687 Ro y’ s lar gest root 0.033 1. 588 c 7. 000 339.000 0.138 0.032 11.114 0.659 Emotion p resentation skill Pillai’ s trace 0.043 1.059 14 .000 676.000 0.392 0.021 14.833 0.676 W ilks’ s lambda 0.957 1. 062 a 14 .000 674.000 0.390 0.022 14.866 0.677 Hotelling’ s trace 0.044 1.064 14 .000 672.000 0.387 0.022 14.898 0.678 Ro y’ s lar gest root 0.037 1. 808 c 7. 000 338.000 0.085 0.036 12.655 0.727 Sociability Pillai’ s trace 0.096 2.440 14 .000 676.000 0.002 0.048 34.160 0.984 W ilks’ s lambda 0.905 2. 458 a 14 .000 674.000 0.002 0.049 34.416 0.985 Hotelling’ s trace 0.103 2.477 14 .000 672.000 0.002 0.049 34.671 0.986 Ro y’ s lar gest root 0.085 4. 105 c 7. 000 338.000 0.000 0.078 28.734 0.987 aExact statistic bComputed using alpha = 0.05 cThe statistic is an upper bound on F that y ields a lo wer bound on the significance le v el dDesign:Intercept + Empathy and communication skill + Stress management + Self-a w areness + Problem-solving + Openness to change + Self-esteem + Self-contentment + Emotion p resentation skill + Sociability
Table 8 Levene test results for the effects of emotional intelligence on each factor of opinions regarding
intellectual capital
F df1 df2 Sig.
Human capital: the quality of human capital 1.201 296 66 0.187
Customer capital: customer dimension 1.246 296 66 0.141
Human capital: shared organizational climate 0.821 296 66 0.860 Structural capital: information technology and information sharing 0.649 296 66 0.991 Human capital: worker organizational commitment 1.514 296 66 0.022
Customer capital: trademark dimension 1.075 296 66 0.371
Customer capital: market dimension 0.860 296 66 0.799
Tests the null hypothesis that the error variance of the dependent variable is equal across groups
Design: Intercept+ Empathy and communication skill + Stress management + Self-awareness + Problem-solving+ Openness to change + Self-esteem + Self-contentment + Emotion presentation skill + Sociability
6 Conclusion and implications
A noteworthy result is that the self-awareness of top managers and their sensitivity toward and interactions with others (i.e., empathy and communication skills and sociability) affect their opinions regarding the intellectual capital of their businesses. That is, these psycho-social capacities and skills of the top managers affect their opinions regarding the intellectual capital of their businesses. This result is compatible with the literature, which demonstrates that intellectual capital contains certain psycho-social factors, such as human and customer capital, human-centered assets and relational capital. In this case, it becomes evident that the psycho-social capacities and skills of the top managers and the psycho-social factors in the intellectual capital of the business may be related. The authors contend that the literature on the psycho-social factors of intellectual capital may be considered to indicate this relationship. In addition, there are significant outcomes when the factors of emotional intelligence and the factors of opinions regarding intellectual capital are considered to be related. One such result is that the empathy and communication skills of the top managers affect their opinions regarding the quality of the workers, i.e., the quality of the human capital, of their businesses. This factor (human capital: the quality of human capital) includes the opinions of the top managers regarding the importance of the educational level, tenure and skills of the workers. These worker qualities are related to behavior. That is, all of these qualities may be revealed by worker behavior in the work context. These worker qualities should be related to the managers because the managers should understand their subordinates’ behaviorsto assess them correctly. In short, a link exists between the workers and the managers. This link is dependent on the behavior of the workers, which reveals their qualifications, and the skill of the managers to judge their subordinates. In fact, these skills concern empathy and communication, as the result indicates.
Another result is that the self-awareness of the top managers affects their opinions about the organizational commitment of their workers. There may be several reasons for this rela-tionship. The self-awareness of the top managers includes their goals, and their opinions regarding worker commitment include directing workers toward organizational goals. Thus, the top managers may link their personal goals with the goals of their organizations and, con-sequently, with the goals of their workers. That is, the personal goals of the top managers may affect their organizations, including the organizations’workers. The relationship between the self-awareness of the top managers and their opinions regarding the organizational
commit-Ta b le 9 The ef fects of each emotional intelligence factor o n each factor o f the opinions re garding intellectual capital T ests o f b etween-subject ef fects Source Dependent variable T ype III sum o f squares df Mean square F Sig. ∂η 2 Noncent. parameter Observ ed po wer b Corrected model Human capital: the quality of human capital 82 .276 a 19 4. 330 22 .535 0. 000 0. 555 428 .159 1. 000 Customer capital: customer dimension 14 .093 c 19 0. 742 1. 053 0. 399 0. 055 20 .009 0. 763 Human capital: shared or ganizational climate 7. 082 d 19 0. 373 0. 551 0. 938 0. 030 10 .466 0. 413 Structural capital: information technology and information sharing 27 .076 e 19 1. 425 1. 649 0. 043 0. 084 31 .339 0. 949 Human capital: w o rk er or ganizational commitment 65 .789 f 19 3. 463 53 .459 0. 000 0. 748 1015 .721 1. 000 Customer capital: trademark dimension 10 .824 g 19 0. 570 0. 947 0. 524 0. 050 18 .000 0. 703 Customer capital: mark et dimension 7. 730 h 19 0. 407 1. 014 0. 443 0. 053 19 .275 0. 742 Intercept H uman capital: the quality of human capital 93.826 1 9 3. 826 488 .267 0. 000 0. 587 488 .267 1. 000 Customer capital: customer dimension 174.262 1 174 .262 247 .407 0. 000 0. 419 247 .407 1. 000 Human capital: shared or ganizational climate 103.431 1 103 .431 152 .857 0. 000 0. 308 152 .857 1. 000 Structural capital: information technology and information sharing 189.170 1 189 .170 218 .952 0. 000 0. 390 218 .952 1. 000 Human capital: w o rk er or ganizational commitment 78.074 1 7 8. 074 1205 .382 0. 000 0. 778 1205 .382 1. 000 Customer capital: trademark dimension 126.845 1 126 .845 210 .941 0. 000 0. 381 210 .941 1. 000 Customer capital: mark et dimension 77.853 1 7 7. 853 194 .117 0. 000 0. 361 194 .117 1. 000
Ta b le 9 continued T ests o f b etween-subject ef fects Source Dependent variable T ype III sum o f squares df Mean square F Sig. ∂η 2 Noncent. parameter Observ ed po wer b Empathy and communication skill Human capital: the quality of human capital 74.016 2 3 7. 008 192 .587 0. 000 0. 529 385 .174 1. 000 Customer capital: customer dimension 1.342 2 0. 671 0. 953 0. 387 0. 006 1. 906 0. 215 Human capital: shared or ganizational climate 1.166 2 0. 583 0. 861 0. 423 0. 005 1. 723 0. 198 Structural capital: information technology and information sharing 0.132 2 0. 066 0. 077 0. 926 0. 000 0. 153 0. 062 Human capital: w o rk er or ganizational commitment 0.050 2 0. 025 0. 386 0. 680 0. 002 0. 773 0. 112 Customer capital: trademark dimension 1.390 2 0. 695 1. 156 0. 316 0. 007 2. 311 0. 253 Customer capital: mark et dimension 0 .460 2 0. 230 0. 573 0. 564 0. 003 1. 147 0. 145 Stress management Human capital: the quality of human capital 0.024 2 0. 012 0. 064 0. 938 0. 000 0. 127 0. 060 Customer capital: customer dimension 3.441 2 1. 720 2. 442 0. 088 0. 014 4. 885 0. 490 Human capital: shared or ganizational climate 0.412 2 0. 206 0. 304 0. 738 0. 002 0. 609 0. 098 Structural capital: information technology and information sharing 0.625 2 0. 312 0. 361 0. 697 0. 002 0. 723 0. 108 Human capital: w o rk er or ganizational commitment 0.303 2 0. 152 2. 341 0. 098 0. 013 4. 682 0. 473 Customer capital: trademark dimension 0.064 2 0. 032 0. 053 0. 948 0. 000 0. 106 0. 058 Customer capital: mark et dimension 0 .040 2 0. 020 0. 049 0. 952 0. 000 0. 098 0. 057
Ta b le 9 continued T ests o f b etween-subject ef fects Source Dependent variable T ype III sum o f squares df Mean square F Sig. ∂η 2 Noncent. parameter Observ ed po wer b Self-a w areness Human capital: the quality of human capital 0.072 2 0. 036 0. 189 0. 828 0. 001 0. 377 0. 079 Customer capital: customer dimension 0 .627 2 0. 313 0. 445 0. 641 0. 003 0. 890 0. 122 Human capital: shared or ganizational climate 1.390 2 0. 695 1. 027 0. 359 0. 006 2. 054 0. 229 Structural capital: information technology and information sharing 0.185 2 0. 093 0. 107 0. 898 0. 001 0. 214 0. 066 Human capital: w o rk er or ganizational commitment 60.685 2 3 0. 342 468 .457 0. 000 0. 732 936 .915 1. 000 Customer capital: trademark d imension 0.110 2 0. 055 0. 092 0. 912 0. 001 0. 184 0. 064 Customer capital: mark et dimension 0 .520 2 0. 260 0. 649 0. 523 0. 004 1. 298 0. 159 Problem-solving Human capital: the quality of human capital 0.153 1 0. 153 0. 795 0. 373 0. 002 0. 795 0. 144 Customer capital: customer dimension 0 .208 1 0. 208 0. 296 0. 587 0. 001 0. 296 0. 084 Human capital: shared or ganizational climate 0.064 1 0. 064 0. 094 0. 759 0. 000 0. 094 0. 061 Structural capital: information technology and information sharing 0.110 1 0. 110 0. 128 0. 721 0. 000 0. 128 0. 065 Human capital: w o rk er or ganizational commitment 0.141 1 0. 141 2. 175 0. 141 0. 006 2. 175 0. 313 Customer capital: trademark d imension 0.178 1 0. 178 0. 296 0. 587 0. 001 0. 296 0. 084 Customer capital: mark et dimension 0 .999 1 0. 999 2. 490 0. 115 0. 007 2. 490 0. 350 Openness to change Human capital: the quality of human capital 0.113 2 0. 056 0. 293 0. 746 0. 002 0. 586 0. 096 Customer capital: customer dimension 1 .061 2 0. 531 0. 753 0. 472 0. 004 1. 506 0. 178 Human capital: shared or ganizational climate 0.079 2 0. 040 0. 059 0. 943 0. 000 0. 117 0. 059
Ta b le 9 continued T ests o f b etween-subject ef fects Source Dependent variable T ype III sum o f squares df Mean square F Sig. ∂η 2 Noncent. parameter Observ ed po wer b Structural capital: information technology and information sharing 1.002 2 0. 501 0. 580 0. 560 0. 003 1. 160 0. 146 Human capital: w o rk er or ganizational commitment 0.013 2 0. 006 0. 100 0. 905 0. 001 0. 200 0. 065 Customer capital: trademark d imension 3.611 2 1. 806 3. 003 0. 051 0. 017 6. 005 0. 580 Customer capital: mark et dimension 2 .265 2 1. 133 2. 824 0. 061 0. 016 5. 648 0. 553 Self-esteem Human capital: the quality of human capital 0.713 3 0. 238 1. 237 0. 296 0. 011 3. 712 0. 331 Customer capital: customer dimension 0 .818 3 0. 273 0. 387 0. 762 0. 003 1. 161 0. 126 Human capital: shared or ganizational climate 0.462 3 0. 154 0. 228 0. 877 0. 002 0. 683 0. 093 Structural capital: information technology and information sharing 1.898 3 0. 633 0. 732 0. 533 0. 006 2. 196 0. 206 Human capital: w o rk er or ganizational commitment 0.221 3 0. 074 1. 138 0. 334 0. 010 3. 413 0. 306 Customer capital: trademark d imension 1.301 3 0. 434 0. 721 0. 540 0. 006 2. 164 0. 203 Customer capital: mark et dimension 0 .079 3 0. 026 0. 066 0. 978 0. 001 0. 198 0. 062 Self-contentment H uman capital: the quality of human capital 0.148 3 0. 049 0. 256 0. 857 0. 002 0. 769 0. 099 Customer capital: customer dimension 2 .609 3 0. 870 1. 235 0. 297 0. 011 3. 704 0. 330 Human capital: shared or ganizational climate 2.285 3 0. 762 1. 126 0. 339 0. 010 3. 377 0. 303 Structural capital: information technology and information sharing 0.468 3 0. 156 0. 180 0. 910 0. 002 0. 541 0. 083 Human capital: w o rk er or ganizational commitment 0.153 3 0. 051 0. 787 0. 502 0. 007 2. 360 0. 219 Customer capital: trademark d imension 0.366 3 0. 122 0. 203 0. 894 0. 002 0. 609 0. 088 Customer capital: mark et dimension 2 .194 3 0. 731 1. 824 0. 142 0. 016 5. 472 0. 473 Emotion p resentation skill Human capital: the quality of human capital 0.757 2 0. 378 1. 969 0. 141 0. 011 3. 938 0. 407 Customer capital: customer dimension 1 .686 2 0. 843 1. 197 0. 303 0. 007 2. 394 0. 261
Ta b le 9 continued T ests o f b etween-subject ef fects Source Dependent variable T ype III sum o f squares df Mean square F Sig. ∂η 2 Noncent. parameter Observ ed po wer b Human capital: shared or ganizational climate 0.886 2 0. 443 0. 655 0. 520 0. 004 1. 309 0. 160 Structural capital: information technology and information sharing 1.019 2 0. 509 0. 590 0. 555 0. 003 1. 179 0. 148 Human capital: w o rk er or ganizational commitment 0.120 2 0. 060 0. 926 0. 397 0. 005 1. 852 0. 210 Customer capital: trademark d imension 1.017 2 0. 508 0. 846 0. 430 0. 005 1. 691 0. 195 Customer capital: mark et dimension 0 .362 2 0. 181 0. 451 0. 637 0. 003 0. 902 0. 123 Sociability Human capital: the quality of human capital 0.380 2 0. 190 0. 990 0. 373 0. 006 1. 980 0. 222 Customer capital: customer dimension 0 .390 2 0. 195 0. 277 0. 758 0. 002 0. 554 0. 094 Human capital: shared or ganizational climate 0.203 2 0. 102 0. 150 0. 860 0. 001 0. 301 0. 073 Structural capital: information technology and information sharing 21.617 2 1 0. 808 12 .510 0. 000 0. 068 25 .020 0. 996 Human capital: w o rk er or ganizational commitment 0.087 2 0. 043 0. 670 0. 512 0. 004 1. 341 0. 163 Customer capital: trademark d imension 2.624 2 1. 312 2. 182 0. 114 0. 013 4. 364 0. 445 Customer capital: mark et dimension 0 .340 2 0. 170 0. 424 0. 655 0. 002 0. 848 0. 119 Error H uman capital: the quality of human capital 65.912 343 Customer capital: customer dimension 241.593 343 Human capital: shared or ganizational climate 232.092 343 Structural capital: information technology and information sharing 296.345 343 Human capital: w o rk er or ganizational commitment 22.216 343 Customer capital: trademark d imension 206.256 343 Customer capital: mark et dimension 137.564 343
Ta b le 9 continued T ests o f b etween-subject ef fects Source Dependent variable T ype III sum o f squares df Mean square F Sig. ∂η 2 Noncent. parameter Observ ed po wer b T o tal Human capital: the quality of human capital 2267.000 363 Customer capital: customer dimension 3005.000 363 Human capital: shared or ganizational climate 2087.000 363 Structural capital: information technology and information sharing 3326.000 363 Human capital: w o rk er or ganizational commitment 1465.000 363 Customer capital: trademark d imension 2307.000 363 Customer capital: mark et dimension 1534.000 363 Corrected total Human capital: the quality of human capital 148.187 362 Customer capital: customer dimension 255.686 362 Human capital: shared or ganizational climate 239.174 362 Structural capital: information technology and information sharing 323.421 362 Human capital: w o rk er or ganizational commitment 88.006 362 Customer capital: trademark d imension 217.080 362 Customer capital: mark et dimension 145.295 362 aR 2= 0. 555 (adjusted R 2= 0. 531) bComputed using alpha = 0.05 cR 2= 0. 055 (adjusted R 2= 0. 003) dR 2= 0. 030 (adjusted R 2= 0. 024) eR 2= 0. 084 (adjusted R 2= 0. 033) fR 2= 0. 748(adjusted R 2= 0. 734) gR 2= 0. 050 (adjusted R 2= 0. 003) hR 2= 0. 053 (adjusted R 2= 0. 001)
ment of their workers may also be due to the consciousness of the top managers regarding the strong and weak aspects of their characters, which is an aspect of their self-awareness. The emotional intelligence skill enables individuals to criticize themselves. Such self-criticism is expected to result in objectivity, and this objectivity may be reflected in the opinions of the top managers regarding the pleasure that workers derive from the work context, which is one aspect of the opinions regarding worker organizational commitment. Furthermore, top managers, as the leaders of their businesses, are expected to identify themselves with their businesses. This identification may be extended to the workers. The concept of organizational
citizenship might be involved in this identification.
The third result is that the sociability of the top managers affects their opinions regarding information technology and information sharing. Sociability includes being social, making friends and helping others: in short, social interactions and sharing. In addition, the top managers may have believed that the information technology infrastructure of their businesses could promote such social interaction in addition to processing business-related intelligence. These three results may be considered together, from which it can be observed that two effective factors related to emotional intelligence (i.e., empathy and communication skills and sociability) are outwardly directed, whereas one factor (self-awareness) is inwardly directed. The affected factors of the opinions regarding intellectual capital are related to the workers and the issues of information system and sharing. The aggregate results suggest that outwardly directed emotional capacities play a larger role in opinions regarding intellectual capital. In addition, the characteristics of the human capital, in the form of the quality and the commitments of the workers, are obviously considered by the top managers. This outcome is in agreement with the literature, which notes that emotionality is significantly related to human capital within intellectual capital.
The paper’s conclusions reflected two different approaches so far. First, the authors con-sidered the effect of each emotional intelligence factor on the opinions regarding intellectual capital. Then, the effect of each emotional intelligence factor on each factor of the opinions regarding intellectual capital was addressed.
Finally, the authors examined the effects of the emotional intelligence of the top managers on each factor that contributes to the opinions regarding intellectual capital. The findings demonstrate that the emotional intelligence of the top managers affects their opinions about the quality of human capital and information technology and sharing.
Together, these three approaches enable the following inferences. The emotional intel-ligence of the top managers partly affects their opinions about the intellectual capital of their businesses. This partial effect stems from the psycho-social aspects of the emotional intelligence of the top managers and affects their opinions regarding their organization’s workers and the information-sharing infrastructure. In general, all of the outcomes agree with the literature, which asserts that emotionality is not sub-capital of intellectual capital and that emotional intelligence is relevant to the human and information aspects of intellectual capital.
References
Acar, F.: Emotional intelligence and leadership (In Turkish). Erciyes Univ. J. Inst. Social Sci. 12, 53–68 (2002) Akbay, G.: Intellectual Capital and a Practice on the Banking Sector (In Turkish). Uludag University, Turkey,
Master’s thesis (2007)
Akbolat, M., Isik, O.: The effect of health sector workers’ emotional intelligence levels on their motivation (In Turkish). Dumlupinar Univ. J. Social Sci. 32, 109–124 (2012)