CURRENT ACCOUNT DEFICIT WIDENS
AS ECONOMY RECOVERS
Zümrüt İmamoğlu* and Barış Soybilgen† Executive Summary
In February, the Industrial Production Index (IPI) increased by 1.5 percent from January. Export volume index increased by 5.1 percent and import volume index increased by 2.6 percent. The increase in the IPI in February turned the quarterly outlook of the IPI from stagnant to positive. As exports recovered its losses in December and January and imports continued increasing, the first quarter growth seems more promising. Betam increased its quarter on quarter (QoQ) forecast for the first quarter from 0.5 percent to 0.7 percent. The corresponding year on year (YoY) growth rate is 2.4 percent.
In January, the trade deficit was almost stagnant, increasing only $0,2 billion. In February, it increased by $1 billion over the same month of last year, reaching $6.9 billion. The current account deficit (CAD) also followed, increasing up to $5.1 billion in February. As a result, the 12-month CAD increased significantly for the first time since October 2011 and reached $48.4 billion. Betam expects the current account deficit to GDP ratio to stay at 6 percent at the end of the first quarter, same as the previous quarter.
* Dr. Zümrüt İmamoğlu, Betam, Research Associate. [email protected]
† Barış Soybilgen, Betam, Research Assistant, [email protected]
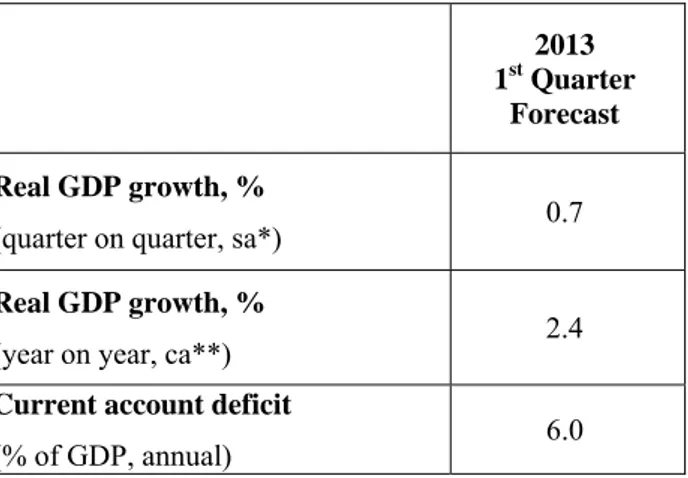
Table 1: Betam’s quarterly and annual growth rate forecasts
Source: Betam.
*sa: seasonally and calendar day adjusted **ca: calendar day adjusted
First clear sign of revival in 2013
The IPI surged in February. The YoY increase in the IPI is above 4 percent for the first time since last May (Figure 5). Therefore, the IPI more than compensated for its fall in December. The average index value for the first two months of the year, has increased by 3.2 percent YoY and 1.1 percent QoQ. The March industrial production figure is of uttermost importance for first quarter growth. If the IPI continues its increase, the revival in the economy will be confirmed, at least for the first quarter.
On the downside, the ongoing decline in the CAD stopped in January after a year and a half, and it
2013 1st Quarter
Forecast
Real GDP growth, %
(quarter on quarter, sa*) 0.7
Real GDP growth, %
(year on year, ca**) 2.4
Current account deficit
(% of GDP, annual) 6.0
Economic Outlook and Forecasts:
April 2013
increased for the first time in February. The strong negative relationship between growth and the current account balance remains as a structural problem. Without a structural change, Turkey cannot balance both net exports and domestic demand. In other words, Turkey cannot sustain a balanced growth regime where both net exports and domestic demand contributes positively to GDP growth.
Imports continued to rise in February following the surge in January. In the first two months, import volume index increased by 4.3 percent compared to the previous quarter. On the other hand, exports decreased by 2.3 percent in the same period despite the recovery in February. Gold trade has not been substantial in this period. Therefore, gold excluded exports and imports data indicate similar results. If imports continue to increase at this pace in March, net exports will most likely subtract from the GDP growth in the first quarter.
On the other hand, signs from other indicators about the revival are still mixed. Increases in intermediate and investment goods imports are positive signs as well as increases in investment goods production and real sector confidence index in both January and February. However, non-durable goods production continues to decline QoQ in spite of the increase in February. Moreover, consumer confidence index declined in both February and March.
Despite mixed signals, increases in exports and the IPI in February have led us to raise our quarter on quarter forecast for the first quarter from 0.5
percent to 0.7 percent. The corresponding year on year (YoY) growth rate is 2.4 percent. Betam expects the current account deficit to GDP ratio to remain as 6 percent at the end of the first quarter.
Limited increase in private consumption expenditure
Consumer and non-durable goods imports increased by 6.8 and 0.5 percent, respectively, in February from the previous month. Following declines in December and January, durable goods production recovered slightly in February and increased by 3.2 percent. Consumer confidence index decreased by 0.2 percent and 1.4 percent in February and March, respectively, but it is still above its average level in the previous quarter. We expect private consumption expenditure to contribute positively to GDP growth in the first quarter of 2013.
The recovery in private investment expenditure
In the first quarter of 2013, both the intermediate goods and investment goods imports are above their levels in the previous quarter. Moreover, investment goods production increased by 2.5 percent and 5.9 percent in January and February, respectively. The 1.5 percent increase in the IPI in February is also encouraging for investment demand. On the other hand, both the real sector confidence index and capacity utilization rate are below their levels in the previous quarter, even though they both increased in February and March. We believe that increases in investment goods production and imports imply a revival in
investment demand and we expect an increase in investment expenditures in the first quarter.
Contribution of net exports could be negative in the 1st quarter
Figure 2 shows monthly changes of seasonally adjusted import and export volume indices. In February, export volume index increased by 5.1 percent and the import volume index increased by 2.6 percent. Even though the export volume index had declined by 2 percent in the last quarter of 2012 compared to the third quarter, in the same period total exports of goods and services in GDP accounts increased and contributed positively to GDP growth. This surprising development caused us to forecast the direction of the contribution of net exports wrong. On the other hand, we expect that the general trend doesn’t change and net exports in national accounts will move in the same direction as volume indices. In the first quarter, the divergence between export and import volume indices is getting larger as imports increase. Therefore, we expect net exports to subtract from GDP growth in the first quarter.
The current account deficit increased in February
In January, the trade deficit increased slightly, $0,2 billion and the current account deficit stayed almost at the same level compared to the same month of the previous year. In February, the current account deficit increased by $1 billion over the same month of the previous year. The 12-month total current account deficit increased significantly for the first time since October 2011.
The 12-month current account deficit, which was 47.6 billion dollar at the end of January, increased to $48.4 billion at the end of February. In 2013, so far, gold trade is not as effective on trade figures as it was in 2012. Net export of gold in February was negative and increased the trade deficit by $0.5 billion.
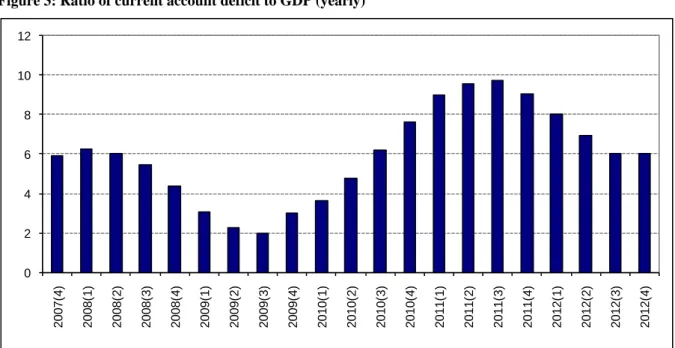
Betam expects that the current account deficit to GDP ratio, which was 6 percent at the end of 2012, to remain at the same level at the end of the first quarter. However, if imports continue to increase in March, the current account deficit might increase further and push the ratio up as well.
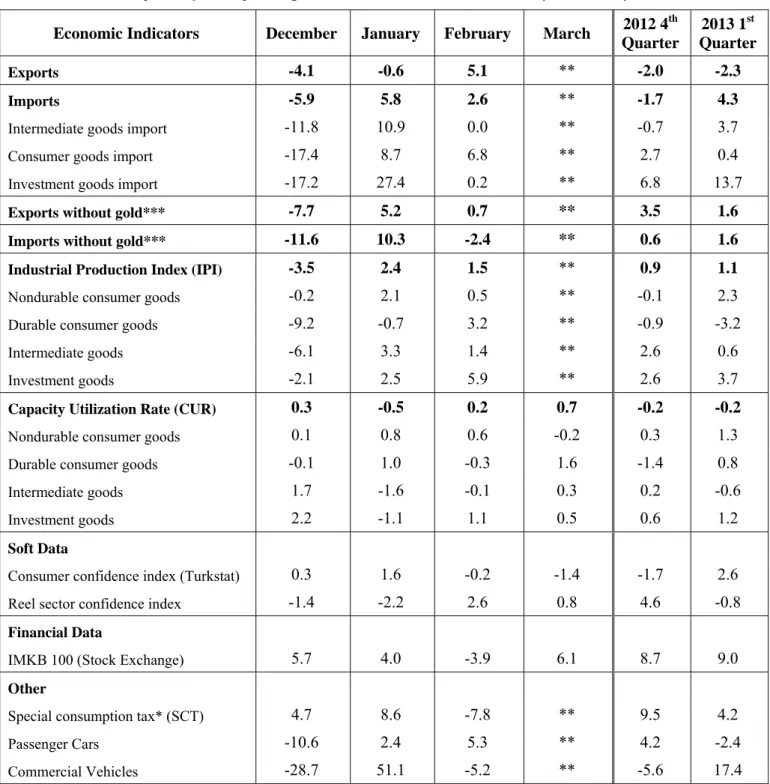
Table 2: Monthly and quarterly changes of Betam’s selected indicators (real and sa)
Economic Indicators December January February March 2012 4 th Quarter 2013 1st Quarter Exports -4.1 -0.6 5.1 ** -2.0 -2.3 Imports -5.9 5.8 2.6 ** -1.7 4.3
Intermediate goods import -11.8 10.9 0.0 ** -0.7 3.7
Consumer goods import -17.4 8.7 6.8 ** 2.7 0.4
Investment goods import -17.2 27.4 0.2 ** 6.8 13.7
Exports without gold*** -7.7 5.2 0.7 ** 3.5 1.6
Imports without gold*** -11.6 10.3 -2.4 ** 0.6 1.6 Industrial Production Index (IPI) -3.5 2.4 1.5 ** 0.9 1.1
Nondurable consumer goods -0.2 2.1 0.5 ** -0.1 2.3
Durable consumer goods -9.2 -0.7 3.2 ** -0.9 -3.2
Intermediate goods -6.1 3.3 1.4 ** 2.6 0.6
Investment goods -2.1 2.5 5.9 ** 2.6 3.7
Capacity Utilization Rate (CUR) 0.3 -0.5 0.2 0.7 -0.2 -0.2
Nondurable consumer goods 0.1 0.8 0.6 -0.2 0.3 1.3
Durable consumer goods -0.1 1.0 -0.3 1.6 -1.4 0.8
Intermediate goods 1.7 -1.6 -0.1 0.3 0.2 -0.6
Investment goods 2.2 -1.1 1.1 0.5 0.6 1.2
Soft Data
Consumer confidence index (Turkstat) 0.3 1.6 -0.2 -1.4 -1.7 2.6
Reel sector confidence index -1.4 -2.2 2.6 0.8 4.6 -0.8
Financial Data
IMKB 100 (Stock Exchange) 5.7 4.0 -3.9 6.1 8.7 9.0
Other
Special consumption tax* (SCT) 4.7 8.6 -7.8 ** 9.5 4.2
Passenger Cars -10.6 2.4 5.3 ** 4.2 -2.4
Commercial Vehicles -28.7 51.1 -5.2 ** -5.6 17.4
Source: TurkStat, CBRT, Treasury, ISE, Betam. All series are real (or inflation adjusted) wherever necessary and seasonally adjusted. *This tax is collected on sales of goods such as gas, fuel oils, alcohol, tobacco products and automobiles.
**Data not yet released.
Figure 1: Capacity utilization rate and industrial production index (sa. left axis for CUR and right axis for IPI)
Source: TurkStat. Betam.
Figure 2: Volume indices of exports and imports (sa)
Source: Turkstat, Betam.
Figure 3: Ratio of current account deficit to GDP (yearly)
Source: CBRT. TurkStat. Betam.
75 80 85 90 95 100 105 110 115 120 55 60 65 70 75 80 85 Ja n -0 7 May -07 Se p -0 7 Ja n -0 8 Ma y -0 8 Se p -0 8 Ja n -0 9 Ma y -0 9 Se p -0 9 Ja n -1 0 May -10 Se p -1 0 Ja n -1 1 Ma y -1 1 Se p -1 1 Ja n -1 2 Ma y -1 2 Se p -1 2 Ja n -1 3 CUR IPI 0 2 4 6 8 10 12 2007( 4) 2008( 1) 2008( 2) 2008( 3) 2008( 4) 2009( 1) 2009( 2) 2009( 3) 2009( 4) 2010( 1) 2010( 2) 2010( 3) 2010( 4) 2011( 1) 2011( 2) 2011( 3) 2011( 4) 2012( 1) 2012( 2) 2012( 3) 2012( 4) 70 80 90 100 110 120 130 140 Jan -0 7 May-07 Se p -0 7 Jan -0 8 May-08 Se p -0 8 Jan -0 9 May-09 Se p -0 9 Jan -1 0 May-10 Se p -1 0 Jan -1 1 May-11 Se p -1 1 Jan -1 2 May-12 Se p -1 2 Jan -1 3 Export Import
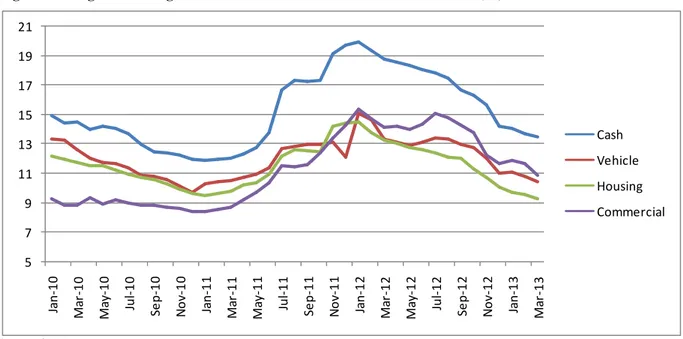
Figure 4: Weighted Average Interest Rates for Turkish Lira Banks' Loans (%)
Source: CBRT.
Figure 5: YoY increase in IPI in 2012 and 2013 (calendar day adjusted)
. Source: Turkstat. 5 7 9 11 13 15 17 19 21 Jan ‐10 Ma r‐ 10 Ma y‐ 10 Ju l‐ 10 Se p ‐10 No v‐ 10 Jan ‐11 Ma r‐ 11 Ma y‐ 11 Ju l‐ 11 Se p ‐11 No v‐ 11 Jan ‐12 Ma r‐ 12 Ma y‐ 12 Ju l‐ 12 Se p ‐12 No v‐ 12 Jan ‐13 Ma r‐ 13 Cash Vehicle Housing Commercial ‐3,0 ‐2,0 ‐1,0 0,0 1,0 2,0 3,0 4,0 5,0 6,0 7,0 2012 2013