CAPITAL RATIOS OVER THE CYCLE:
EVIDENCE FROM THE TURKISH BANKING SECTOR
A Master‟s Thesis
by
AYġE AYDOĞAN
Department of Management
Ġhsan Doğramacı Bilkent University Ankara
CAPITAL RATIOS OVER THE CYCLE:
EVIDENCE FROM THE TURKISH BANKING SECTOR
Graduate School of Economics and Social Sciences of
Ġhsan Doğramacı Bilkent University
by
AYġE AYDOĞAN
In Partial Fulfillment of Requirements for the Degree of MASTER OF SCIENCE
in
THE DEPARTMENT OF MANAGEMENT
ĠHSAN DOĞRAMACI BILKENT UNIVERSITY ANKARA
I certificate that I have read this thesis and found that it is fully adequate, in scope and in quality, as a thesis for the degree of Master of Science in Management
--- Assoc. Prof. Süheyla Özyıldırım Supervisor
I certificate that I have read this thesis and found that it is fully adequate, in scope and in quality, as a thesis for the degree of Master of Science in Management
--- Assoc. Prof. Zeynep Önder Examining Committee Member
I certificate that I have read this thesis and found that it is fully adequate, in scope and in quality, as a thesis for the degree of Master of Science in Management
--- Assist. Prof. Seza DanıĢoğlu Examining Committee Member
Approval of the Graduate School of Economics and Social Sciences ---
Prof. Dr. Erdal Erel Director
iii
ABSTRACT
CAPITAL RATIOS OVER THE CYCLE:
EVIDENCE FROM THE TURKISH BANKING SECTOR Aydoğan, AyĢe
M.S., Department of Management Supervisor: Assoc. Prof. Süheyla Özyıldırım
August 2015
This study examines the behavior of capital ratios of Turkish banks over the business and financial cycles in the period of 1993:Q4-2014:Q3 and the sub-period 2003:Q1-2014:Q3. Capital adequacy ratio defined by Basel Committee on Banking Supervision and equity to asset ratio are used in the analyses. The capital ratios are found to behave countercyclical over the cycle, which is more pronounced in the subsample of 2003:Q1-2014:Q3. Banks‟ capital ratios react more to the movements in the financial cycle than business cycle. The risk based capital adequacy ratio behaves more countercyclical than equity to asset ratio. Lagged capital ratios, credit risk, size, profitability, funding structure and liquidity are found to be significant determinants of capital ratios. Capital ratios of Turkish banks are sensitive to the changes in Turkish legislation on capital adequacy.
Keywords: Capital Ratios, Capital Regulation, Business Cycle, Financial Cycle, Turkish Banking Sector
iv
ÖZET
SERMAYE ORANLARI VE ÇEVRĠMLER: TÜRK BANKACILIK SĠSTEMĠ ÖRNEĞĠ
Aydoğan, AyĢe
Yüksek Lisans, ĠĢletme Bölümü Tez Yöneticisi: Doç. Dr. Süheyla Özyıldırım
Ağustos 2015
Bu çalıĢmada bankaların sermaye oranları ile iĢ çevrimleri ve finansal çevrimler arasındaki iliĢkisi 1994:Ç4-2014:Ç3 dönemi ile 2003:Ç1-2014:Ç3 alt döneminde incelenmiĢtir. Analizlerde Basel Bankacılık Denetim Komitesi‟nin tanımladığı sermaye yeterlilik oranı ile özkaynakların varlıklara oranı kullanılmıĢtır. Sermaye oranlarının, 2003:Ç1-2014:Ç3 alt döneminde daha belirgin olmak üzere, döngüsellik karĢıtı hareket ettiği gözlenmiĢtir. Bankaların sermaye oranları finansal çevrimlerdeki hareketlere iĢ çevrimlerindeki hareketlere göre daha fazla tepki vermektedir. Risk tabanlı sermaye yeterlilik oranı, özkaynakların varlıklara oranına göre daha fazla döngüsellik karĢıtı hareket etmektedir. Gecikmeli sermaye oranları, kredi riski, büyüklük, karlılık, fonlama yapısı ve likidite sermaye oranlarının anlamlı belirleyicileri olarak bulunmuĢtur. Türk bankalarının sermaye oranları, sermaye yeterliliğine iliĢkin yönetmelik değiĢikliklerine duyarlıdır. Anahtar Kelimeler: Sermaye Oranları, Sermaye Düzenlemesi, ĠĢ Çevrimi, Finansal Çevrim, Türk Bankacılık Sektörü
v
ACKNOWLEDGMENTS
I would like to express my gratitude to Assoc. Prof Süheyla Özyıldırım for her guidance, attention, encouragement and positiveness.
I would like to express my thanks to Assoc. Prof Zeynep Önder and Assist. Prof. Seza DanıĢoğlu for their valuable comments and feedbacks, which helped me enhance my research.
I would like to thank TÜBĠTAK (The Scientific and Technological Research Council of Turkey) for their financial support in my graduate study. I would like to appreciate the academic support and excellent education of Bilkent University.
I would like to thank warmly my colleagues in the Central Bank of the Republic of Turkey for their sincerity, encouragement and their help in gathering data to use in this thesis.
I would like to express heartfelt thanks to my family and my fiancé Bayındır Karasoy for their love and endless support in every step of my life.
vi
TABLE OF CONTENTS
ABSTRACT ... iii ÖZET ... iv ACKNOWLEDGMENTS ... v TABLE OF CONTENTS ... viLIST OF TABLES ... viii
LIST OF FIGURES ... xi
CHAPTER 1: INTRODUCTION ... 1
CHAPTER 2: OVERVIEW OF THE TURKISH BANKING SECTOR ... 7
2.1 Structural Indicators ... 8
2.2 Size of the Banking Sector ... 10
2.3 Structure of the Bank Balance Sheet ... 11
2.4 Credit Risk ... 13
2.5 Liquidity Risk ... 14
2.6 Profitability ... 15
2.7 Capital Adequacy ... 16
CHAPTER 3: THE BASEL FRAMEWORK ... 18
3.1 The Basel Rules Historically... 18
3.2 Compliance to Basel Rules in Turkey ... 24
CHAPTER 4: LITERATURE REVIEW... 29
CHAPTER 5: DATA AND METHODOLOGY ... 36
vii
5.2 Data ... 38
Dependent and Explanatory Variables ... 39
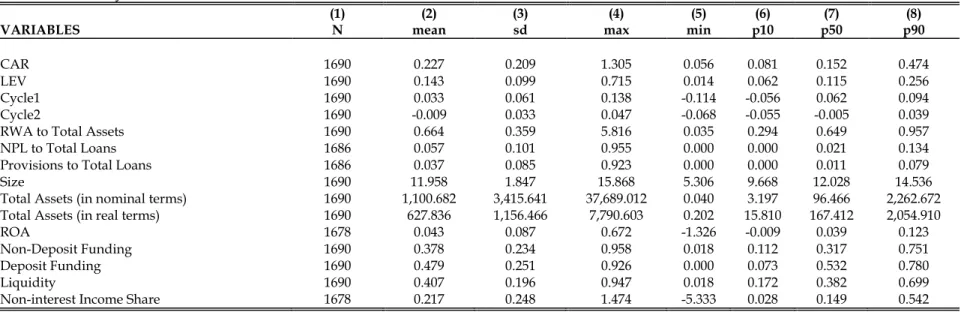
5.3 Descriptive Statistics ... 46
CHAPTER 6: RESULTS ... 50
6.1 Robustness Check ... 63
CHAPTER 7: CONCLUSION ... 64
APPENDICES APPENDIX A. DESCRIPTIVE STATISTICS ... 73
APPENDIX B. ECONOMETRIC RESULTS ... 82
viii
LIST OF TABLES
Table 1. Variable Descriptions ... 46
Table A1. Summary Statistics for Selected Variables ... 74
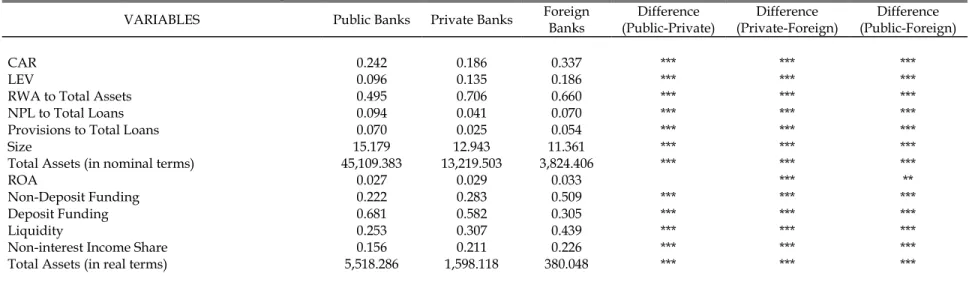
Table A2. Summary Statistics across Banking Groups ... 75
Table A2. Summary Statistics across Banking Groups (cont‟d) ... 76
Table A2. Summary Statistics across Banking Groups (cont‟d) ... 78
Table A3. Correlation Matrix ... 79
Table A4. Summary Statistics for Selected Variables Before 2002 ... 80
Table A5. Summary Statistics for Selected Variables After 2002 ... 81
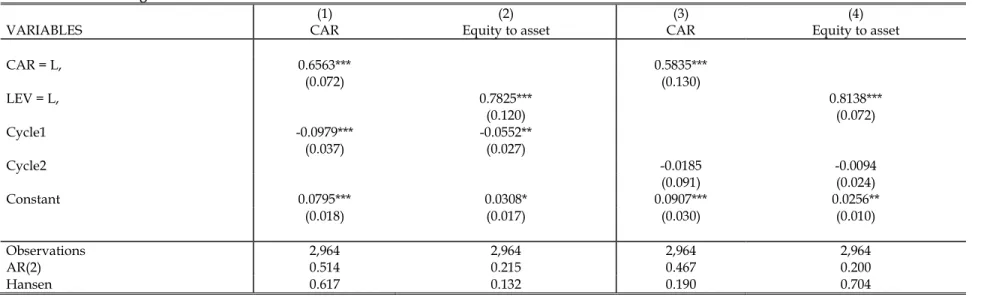
Table B6. Baseline Regressions ... 83
Tablo B6. Baseline Regressions (cont‟d) ... 84
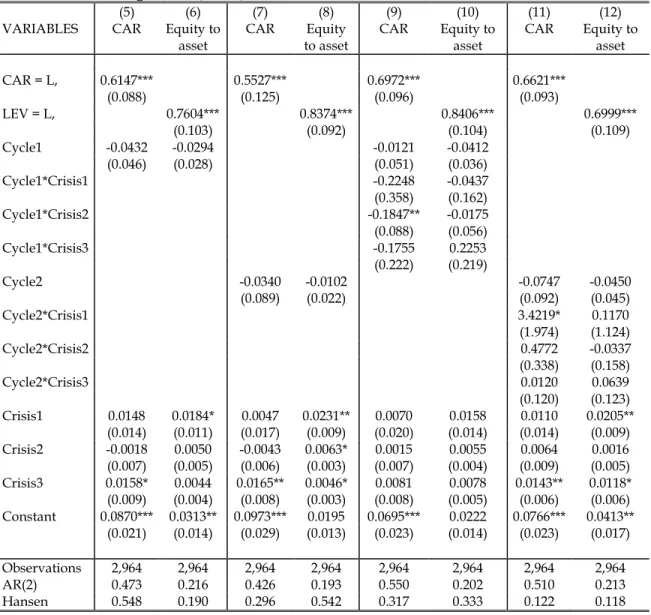
Table B7. Regressions Controlling for Basic Bank Characteristics ... 85
Table B7. Regressions Controlling for Basic Bank Characteristics (cont‟d) .... 86
Table B7. Regressions Controlling for Basic Bank Characteristics (cont‟d) .... 87
Table B8. Regressions Controlling for Other Bank Characteristics ... 88
Table B8. Regressions Controlling for Other Bank Characteristics (cont‟d) ... 90
Table B9. Regressions Controlling for Other Bank Characteristics ... 92
Table B9. Regressions Controlling for Other Bank Characteristics (cont‟d) ... 94
Table B10. Baseline Regressions for 2003:Q1-2014:Q3 ... 96
Table B10. Baseline Regressions for 2003:Q1-2014:Q3 (cont‟d) ... 97
Table B11. Regressions Controlling For Basic Bank Characteristics for 2003:Q1-2014:Q3 ... 98
ix
Table B11. Regressions Controlling for Basic Bank Characteristics for 2003:Q1-2014:Q3 (cont‟d) ... 99 Table B11. Regressions Controlling for Basic Bank Characteristics for 2003:Q1-2014:Q3 (cont‟d) ... 100 Table B12. Regressions Controlling for Other Bank Characteristics for 2003:Q1-2014:Q3 ... 101 Table B12. Regressions Controlling for Other Bank Characteristics for 2003:Q1-2014:Q3 (cont‟d) ... 102 Table B13. Regressions Controlling for Other Bank Characteristics for 2003:Q1-2014:Q3 ... 103 Table B13. Regressions Controlling for Other Bank Characteristics for 2003:Q1-2014:Q3 (cont‟d) ... 104 Table B14. Regressions with Ownership Dummy Variables for 1993:Q4-2014:Q3 ... 105 Table B15. Regressions with Ownership Dummy Variables for 2003:Q1-2014:Q3 ... 107 Table C16. Regressions Controlling for the Impact of Capital Constrained Banks for 1993:Q4-2014:Q3 ... 110 Table C17. Regressions Controlling for the Impact of Capital Constrained Banks for 2003:Q1-2014:Q3 ... 112 Table C18. Pooled OLS and FGLS Models Considering Business Cycle for 1993:Q4-2014:Q3 ... 113 Table C19. Pooled OLS and FGLS Models Considering Financial Cycle for 1993:Q4-2014:Q3 ... 115 Table C20. Fixed Effects Models for 1993:Q4-2014:Q3 ... 117 Table C21. Pooled OLS and FGLS Models Considering Business Cycle for 2003:Q1-2014:Q3 ... 119
x
Table C22. Pooled OLS and FGLS Models Considering Financial Cycle for 2003:Q1-2014:Q3 ... 121 Table C23. Fixed Effects Models for 2003:Q1-2014:Q3 ... 123 Table C24. Impact of Regulatory Changes When They are Included to the Full Models one-by-one for the Whole Sample Period... 125 Table C25. Impact of Regulatory Changes When They are Included to the Full Models one-by-one for the Sub-sample Period ... 125
xi
LIST OF FIGURES
Figure 2.1. Turkey‟s Financial System Structure ... 7
Figure 2.2. Number of Banks ... 9
Figure 2.3. Number of Branches ... 9
Figure 2.4 Share of Banking Groups ... 10
Figure 2.5. Deposit Banks Based on Ownership ... 10
Figure 2.6. Total Assets to GDP ... 11
Figure 2.7. Total Loans to GDP ... 11
Figure 2.8. Asset Structure ... 12
Figure 2.9. Liability Structure ... 12
Figure 2.10. Asset and Loan Growth ... 13
Figure 2.11. Deposit Growth ... 13
Figure 2.12. NPL Ratio ... 14
Figure 2.13. NPL Ratio by Countries ... 14
Figure 2.14. Liquid Assets ... 15
Figure 2.15. Loan to Deposit Ratio ... 15
Figure 2.16. Profit for the period ... 16
Figure 2.17. Profitability ... 16
Figure 2.18. Capital Adequacy Ratio ... 17
Figure 2.19. Equity to Asset Ratio ... 17
Figure 3.1. Basel Rules Historically in Turkey ... 28
xii
Figure 5.2. Equity to Asset Ratio over the Business Cycle ... 49 Figure 5.3. Capital Adequacy Ratio over the Financial Cycle ... 49 Figure 5.4. Equity to Asset Ratio over the Financial Cycle ... 49
1
CHAPTER 1
INTRODUCTION
Banking sector has been one of the mostly regulated sectors in the financial system. The main focus of supervisory regulations is on the capital adequacy of banks. A major step in that direction was the 1988 Basel Accord to ensure international convergence of supervisory regulations relating to capital adequacy of banks. Since then the regulatory framework has been improved through Basel I, Basel II and Basel III.
The major aim of the bank capital requirements is to increase the resilience of the financial system and promote financial stability (BIS, 2010). However, there are some concerns about the pro-cyclicality of capital requirements. That is, the capital framework may amplify business cycles, which may cause some unintended consequences. As Stolz and Wedow (2011) explain, the argument is that banks are likely to experience capital shocks during cyclical downturns as loan losses may increase and
2
credit risk of borrower may deteriorate. To meet the minimum capital requirements, banks have two options: either to raise capital or to reduce risk weighted assets. If raising new capital is difficult or costly especially in bust periods, banks may choose the second option, which results in the decrease in credit supply. Both cases would lead to a reduction in investment, thereby amplifying cyclical downturn. Conversely, during boom periods, banks tend to increase their risk weighted assets as supply and demand of credit raise with profitable investment opportunities, which result in decrease in capital ratios.
In this study, I examine how banks‟ capital ratios behave over the cycle in Turkey. There is evidence in the literature that the effect of cycle on bank capital buffers may depend on the measure of capital ratios as well as indicator of the cycle (see, e.g., Bikker and Metzemakers, 2004; Guidare et al., 2013; Brei and Gambacorta, 2014). Similarly, I investigate the cyclicality of different definitions of capital ratios with respect to business and financial cycle. I use two definitions of capital ratio: (1) capital adequacy ratio (capital to risk weighted assets) and (2) balance sheet leverage ratio (equity to asset). I measure business cycle as real GDP growth while financial cycle as private credit to GDP gap. The term countercyclical refers to negative relation between capital ratios and cycle in the findings of this study1.
1In the analysis, I concentrate on the statistical relation between capital ratios and cycle for
the explanation of results. Therefore, the term „countercyclical‟ refers to negative relation between capital ratios and the cycle. That is, negative (countercyclical) relation between capital ratios and cycle in this study means having potential to amplify the cycles.
3
My analysis mainly builds on the methodology of Brei and Gambacorta (2014). First, I examine the relation between capital ratios and business and financial cycle and try to understand how the cyclicality of capital ratios changes during normal times and crisis times. Second, I investigate the impact of credit risk, size, profitability, funding structure and liquidity of banks on banks‟ capital ratios. Third, I control the effects of implementing new banking legislations over the sample period. My research questions can be framed as:
1) How do capital ratios of banks operating in Turkey behave over the cycle during 1993:Q4-2014:Q3?
2) How does this relation change over the sub-period of 2003:Q1-2014:Q3?
3) Does the behavior of banks‟ capital ratio vary according to the definition of capital ratios (capital adequacy ratio vs. balance sheet leverage ratio) and cycle (business cycle vs. financial cycle)?
4) Does the behavior of banks‟ capital ratios change during crisis periods?
5) How do capital ratios of banks change according to the bank characteristics?
6) Are banks‟ capital ratios sensitive to the changes in banking regulations?
4
This study makes several contributions to the literature on the behavior of capital ratios in the Turkish Banking Sector. First, I examine how capital ratios of banks operating in Turkey behave over the last twenty years using quarterly data. In this way, this thesis helps us to see how banks changed their behavior especially during the last decade in which whole Turkish banking system extensively restructured. Second, I investigate the behavior of different capital ratios on different cycle indicators. In the previous evidence, the main interest is to study the association between capital adequacy and business cycle but no financial cycle. Third, I control the impact of changes in Turkish banking legislation on capital adequacy in assessing the cyclicality of capital ratios. Finally, to my knowledge, this is the first study that differentiates the behavior of Turkish banks‟ capital ratios during normal periods and both local and global crisis periods.
Using whole sample of 1993:Q4-2014:Q3, I find negative and significant relation between capital ratios and business cycle suggesting countercyclicality of the association. However, the negative relation between capital ratios and business cycle vanishes when I control crisis periods. I provide evidence that banks‟ capital ratios are significantly countercyclical over the financial cycle in normal times controlling for the bank specific characteristics and regulatory changes. During the subsample of 2003:Q1-2014Q3, which covers new regulatory environment and rules for banks operating in Turkey, countercyclical behavior of capital ratios is more pronounced. In the subsample, both capital ratios have negative and
5
significant relation with real GDP growth and credit to GDP gap. In both whole sample and subsample, capital adequacy ratio behaves more countercyclical than equity to asset ratio. Moreover, capital ratios react more to the movements in the financial cycle than business cycle. The stronger negative relation between capital ratios and cycle measures in the subsample of 2003:Q1-2014:Q3 suggests that Basel II might have more pro-cyclical effects in terms of amplifying fluctuations in cycles than Basel I supporting Repullo and Suarez (2013).
I find that banks in Turkey, in general, increase their capital buffers during the volatile periods. I find that capital adequacy ratio is more countercyclical over the business cycle and financial during the local financial crisis particularly during the 2000-2001 crises. This finding seems to be very plausible considering extensive capital injections to restructure banks as part of the Bank Capital Strengthening Program in 2001 (Banking Sector Evaluation Report, 2004). I also provide some evidence that capital adequacy ratio continues to have countercyclical relation with the financial cycle during the global financial crisis.
In terms of the impact of bank specific characteristics and regulatory changes on capital ratios, lagged values of capital ratios are found to be persistently positive and significant, which indicates that the relevance of adjustment costs of capital in the short term. There is a positive relation between credit risk and capital ratios suggesting that banks take into account the riskiness of their credit portfolios in setting capital ratios. Large banks
6
have lower capital ratios in line with the too-big-to-fail hypothesis. I find evidence that there is a positive channel to capital via retained earnings particularly during the subsample of 2003:Q1-2014:Q3. In terms of funding structure, banks that use more non-deposit funding (deposit funding) have higher (lower) capital ratios, in particular when capital adequacy ratio is considered. Liquidity of banks has positive effects on capital ratios, reflecting the prudent behavior of banks. Capital ratios of banks are sensitive to the changes in Turkish legislation on capital adequacy. I observe that tighter regulations regarding the banks‟ capital adequacy seem to lessen the capital buffers of banks operating in Turkey. On the other hand, the amendment of Banking Law in 2005 and Basel III framework which introduces higher capital requirements both in quality and quantity, improved the capital positions of banks.
The rest of this study is organized as follows. The next chapter overviews the Turkish Banking Sector for the sample period of 1993:Q4-2014:Q3. Chapter 3 explains the international Basel Framework and compliance to Basel Rules in Turkey historically. Chapter 4 reviews the literature on the cyclicality of capital ratios. Chapter 5 describes the data and methodology used in this study and presents descriptive statistics. Chapter 6 reports the findings of the analyses. The Chapter 7 concludes the thesis.
7
CHAPTER 2
OVERVIEW OF THE TURKISH BANKING SECTOR
As of end-2014, the asset size of the Turkish financial sector is 2.2 trillion Turkish liras corresponding to 961 billion USD. The ratio of financial sector assets to GDP is 128 percent. In Turkey, banking sector assets represents 89 percent of total financial assets (Figure 2.1).
Figure 2.1
Turkey‟s Financial System Structure* (Percent)
Source: CBRT, BRSA, CMB, Treasury *As of 2014 1.9 1.7 1.5 1.5 1.5 1.2 0.9 0.6 0.1 0.1 0 1 2 3 4 5 6 B a n k s R e a l E s ta te I n v e s tmen t Tr u s ts P e n s ion Fun d s In s u ra n c e Mut u a l F u n d s L e a s in g Fac to ring Fina n c e C o m p a n ies B ro k e r-d e a ler s In v e s tm e n t T ru s ts Ot h e r 89
8
2.1 Structural Indicators
As of end-2014, there are 49 banks operating in the Turkish banking system, 32 of which are deposits banks, 4 participation banks and 13 development and investment banks. The number of banks increased rapidly between 1993-2000 due to the financial liberalization and ease of entrance to the sector (BRSA, From Crisis to Financial Stability, 2010). While the number of banks was 70 in 1993, it reached to 81 in 1999. Compared to end-2000, the number of banks in the financial system declined from 79 to 49 (Figure 2.2). During 1993-2001, there was also an expansion wave in banking services through branches in Turkey (Figure 2.3). However, during the 2000-2001 crisis, due to failed banks and restructuring efforts of surviving banks, number of branches decreased significantly. As of December 2001, 12.3 percent of the branches closed during crisis period (BRSA, From Crisis to Financial Stability 2010). However, the number of branches of banks has been increasing since 2003, which indicates the expansion of access channels to banking services. Banks have been opening branches in order to reach out more customers in a more competitive banking market structure of Turkey.
9
Deposit banks have the highest share in the Turkish banking system. As of end-2014, the share of deposit, participation and development and investment banks in the banking system are 90.5 percent, 5.2 percent and 4.2 percent, respectively (Figure 2.4). While deposit banks are mostly owned by privately and publicly, the share of foreign banks reached to 16.1 percent from 5.4 percent between 2005 and 2014 (Figure 2.5).
Figure 2.2
Number of Banks Figure 2.3 Number of Branches
Source: BRSA, The Bank Association of Turkey Source: BRSA, The Bank Association of Turkey
0 20 40 60 80 100 1993 1996 1999 2002 2005 2008 2011 2014 Participation Banks
Development and Investment Banks Deposit Banks Total 0 2,000 4,000 6,000 8,000 10,000 12,000 14,000 1993 1996 1999 2002 2005 2008 2011 2014
10
2.2 Size of the Banking Sector
As of December 2014, the total asset size of the banking system is 1.9 trillion Turkish liras. The ratio of total assets of the banking sector to GDP increased from 50.8 percent in 1993 to 114 percent in 2014 (Figure 2.6). There has also been a rapid increase in loans of commercial banks since 2004, reaching to 73 percent of GDP in 2014 (Figure 2.7). As it can also be seen from the Figure, during the 1993-2004 period, total loans to GDP ratio was around 20 percent suggesting very limited credit growth over the early period of our analysis.
Figure 2.4
Share of Banking Groups (Percent)
Figure 2.5
Deposit Banks Based on Ownership (Percent)
Source: BRSA, The Bank Association of Turkey Source: BRSA, The Bank Association of Turkey
80 85 90 95 100 1993 1996 1999 2002 2005 2008 2011 2014
Development and Investment Banks Participation Banks Deposit Banks 0 20 40 60 80 100 1993 1996 1999 2002 2005 2008 2011 2014 Public Banks Private Banks Foreign Banks
11
2.3 Structure of the Bank Balance Sheet
Loans are the main items in the asset structure of the banking system with a share of 64 percent in total assets, as of end-2014. Securities have the second highest share with a rate of 15 percent. While share of loans continue to increase, securities portfolio decreased to 15 percent of total assets from the levels around 43 percent in 2003. As it can be seen from Figure 2.8, the share of required reserves and receivables from banks increased in exchange of decrease in the share of securities portfolio. On the liability side, deposits are the primary funding source of banks, although the share of deposits has been decreasing since 2001. The share of issued securities, on the other hand, increased significantly, currently representing the 4.5 percent of total liabilities. It seems that banks started to diversify sources of funding (Figure 2.9). Figure 2.6 Total Assets to GDP (Percent) Figure 2.7 Total Loans to GDP (Percent)
Source: BRSA, The Bank Association of Turkey Source: BRSA, The Bank Association of Turkey
0 20 40 60 80 100 120 1993 1996 1999 2002 2005 2008 2011 2014 0 10 20 30 40 50 60 70 80 1993 1996 1999 2002 2005 2008 2011 2014
12
Since 2003, Turkish banking sector has experienced positive growth. As of end-2014, nominal and real growth rate of assets is 15.1 and 6.4 percent, respectively. Turkey has a rapid loan growth with an annual nominal rate of 18.6 percent and real rate of 9.6 percent (Figure 2.10). However, deposits‟ growth pace is slower than the loan growth rate. As of end-2014, annual nominal growth in deposits is 11.3 and annual real growth in deposits 2.9 percent (Figure 2.11). Figure 2.8 Asset Structure (Percent) Figure 2.9 Liability Structure (Percent)
Source: BRSA, The Bank Association of Turkey
*Receivables from banks includes central bank Source: BRSA, The Bank Association of Turkey *Payables to banks includes central bank
0 100 1993 1995 1997 1999 2001 2003 2005 2007 2009 2011 2013 Other Loans Required Reserves Securities
Receivables from Money Markets Receivables from Banks*
0 100 1993 1995 1997 1999 2001 2003 2005 2007 2009 2011 2013 Other Equity Provisions Securities Issued Payables to Banks
Payabales to Money Markets Deposits
13
2.4 Credit Risk
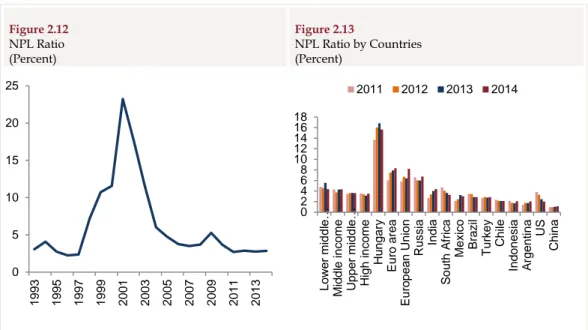
The non-performing loans to total loans (NPL) ratio is 2.85 percent, as of December 2014. The sector‟s NPL ratio demonstrated a significant decline since 2001. Apart from this decline, the NPL ratio has been stabilized around 2-3 percent since 2011 (Figure 2.12). According to the world development indicators, aggregate NPL ratios in countries with respect to all income levels are higher than NPL ratio of the Turkish banking system since 2011 (Figure 2.13) suggesting relatively limited credit risk in the Turkish banking sector compared to other countries.
Figure 2.10
Asset and Loan Growth (Percent)
Figure 2.11
Deposit Growth (Percent)
Source: BRSA, The Bank Association of Turkey Source: BRSA, The Bank Association of Turkey
-50 0 50 100 150 1993 1996 1999 2002 2005 2008 2011 2014
Nominal Loan Growth Real Loan Growth Nominal Asset Growth Real Asset Growth
-20 0 20 40 60 80 100 120 140 160 1993 1996 1999 2002 2005 2008 2011 2014
Nominal Deposit Growth Real Deposit Growth
14
2.5 Liquidity Risk
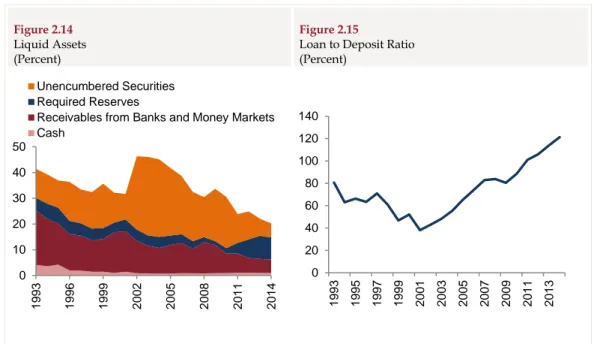
Liquidity risk of the banking sector decreased with the economic stability obtained after 2002 in Turkey. Low interest rate environment led banks to invest in high-yield assets instead of low-yield liquid assets (BRSA, Banking Sector Evaluation Report, 2004). Consequently, as of end-2014, the ratio of liquid assets to total assets decreased to 20 percent from 46 percent in 2003 (Figure 2.14).
Loan to deposit ratio is in the upward trend since 2002 (Figure 2.15). Although this development can be considered as more credit market intermediation activities of banks, non-core funding increases banks‟ sensitivity to liquidity shocks due to its unstable and short term nature. Nevertheless, I can argue that liquidity risk of the banking sector is at manageable levels considering the period after 2000-2001 crisis. Liquidity
Figure 2.12 NPL Ratio (Percent) Figure 2.13 NPL Ratio by Countries (Percent)
Source: BRSA, The Bank Association of Turkey Source: BRSA, The Bank Association of Turkey
0 5 10 15 20 25 1993 1995 1997 1999 2001 2003 2005 2007 2009 2011 2013 0 2 4 6 8 10 12 14 16 18 Lo w er mi d dl e … Mi d d le inc o me U pp er mi d dl e … H igh i n c o m e H u n g a ry E u ro a re a E u ro p e a n Un ion R u s s ia In d ia S o u th A fr ic a Mex ic o B ra z il Tur k e y C h ile In d o n e s ia A rg e n tina US C h ina 2011 2012 2013 2014
15
ratios are significantly above the minimum limits set by the Banking Regulation and Supervision Authority.
2.6 Profitability
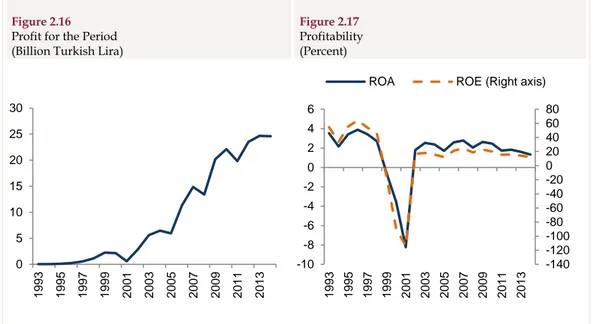
The profitability of the banking sector improved significantly after 2002, mainly reflecting the positive impacts of Banking Sector Restructuring Program introduced in 2001 in response to the crisis. The profits of the banking sector have been increasing. As of end-2014, the profit for the period stands at 24.6 billion Turkish lira (Figure 2.16). However, return on asset and return on equity are on a downward trend in recent years. As of end-2014, return on asset and return on equity are 1.3 percent and 12.3 percent, respectively (Figure 2.17). The fact that net profit of the banking sector increases and profitability ratios remain in a downward trend reflects the
Figure 2.14
Liquid Assets (Percent)
Figure 2.15
Loan to Deposit Ratio (Percent)
Source: BRSA, The Bank Association of Turkey Source: BRSA, The Bank Association of Turkey
0 10 20 30 40 50 1993 1996 1999 2002 2005 2008 2011 2014 Unencumbered Securities Required Reserves
Receivables from Banks and Money Markets Cash 0 20 40 60 80 100 120 140 1993 1995 1997 1999 2001 2003 2005 2007 2009 2011 2013
16
more competitive banking sector and the rise in average assets and average equities.
2.7 Capital Adequacy
While capital adequacy ratio was 9.3 percent in 2000, it reached to 20.3 percent at end-2001, 25.1 percent at end-2002 and 30.9 percent at end-2003. The improvement in capital adequacy stemmed from strengthening the capital of banks within the scope of Banking Sector Restructuring Program that requires fund injections to restructure public banks and SDIF banks financially, and increases in profitability. Since 2003, there is a downtrend in capital adequacy ratio and equity to asset ratio of banks. As of end-2014, capital adequacy ratio of banking sector is 16.3 percent, while equity to asset ratio is 11.6 percent. Despite the downtrend, the capital adequacy ratio of the banking sector is well above the minimum legal requirement (8 percent) and
Figure 2.16
Profit for the Period (Billion Turkish Lira)
Figure 2.17
Profitability (Percent)
Source: BRSA, The Bank Association of Turkey Source: BRSA, The Bank Association of Turkey
0 5 10 15 20 25 30 1993 1995 1997 1999 2001 2003 2005 2007 2009 2011 2013 -140 -120 -100 -80 -60 -40 -20 0 20 40 60 80 -10 -8 -6 -4 -2 0 2 4 6 1993 1995 1997 1999 2001 2003 2005 2007 2009 2011 2013
17
target ratio of 12 percent set by the Banking Regulation and Supervision Authority2 (Figure 2.18 and 2.19).
2 Banking Regulation Supervisory Board announced a target capital adequacy ratio of 12
percent in November 2006. It is decided that banks that fall below 12 percent will not be able to open new branches.
Figure 2.18
Capital Adequacy Ratio (Percent)
Figure 2.19
Equity to Asset Ratio (Percent)
Source: BRSA, The Bank Association of Turkey Source: BRSA, The Bank Association of Turkey
0 5 10 15 20 25 30 35 1993 1995 1997 1999 2001 2003 2005 2007 2009 2011 2013
Capital Adequacy Ratio Tier 1 Capital Ratio
0 2 4 6 8 10 12 14 16 1993 1995 1997 1999 2001 2003 2005 2007 2009 2011 2013
18
CHAPTER 3
THE BASEL FRAMEWORK
3.1 The Basel Rules Historically
The Basel I, II and III rules are published by the Basel Committee, which is the standard setting body for the prudential regulation of banks. The main aim of the Basel rules is to increase the resiliency of the banking system and enhance financial stability.
The Basel Committee on Banking Supervision started to work to ensure internationally uniform capital adequacy standards in 1980‟s. In this respect, the Basel Accord (Basel I) was published on July 1988. The framework was designed for internationally active banks. But, national authorities had the discretion to apply the framework for other banks.
The main focus of Basel I is on the default risk of counterparty, namely, credit risk. Credit risk is calculated by assigning assets and off-balance sheet items across different categories based on their relative
19
riskiness. Then, assets and off balance sheet items in different categories are multiplied with corresponding risk weights to reach the risk weighted assets. There were five risk weights in Basel I framework: (i) 0 percent (ii) 10 percent (iii) 20 percent (iv) 50 percent (v) 100 percent. Capital is defined in terms of Tier 1 capital and Tier 2 capital. Tier 1 capital is the core element of capital. Tier 1 capital includes shareholders‟ equity and disclosed reserves (which is created by retained earnings and other surplus like share premiums). Tier 2 capital is the supplementary elements of capital. It consists of undisclosed reserves, asset revaluation reserves, general provisions, hybrid (debt/equity) capital instruments and subordinated debt. Capital adequacy ratio is calculated as capital divided by risk weighted assets. The minimum requirement is set at 8 percent with a minimum Tier 1 capital ratio of 4 percent.
In 1996, the Basel Committee amended the Basel Capital Accord to cover market risk. With this amendment, banks are required to calculate capital charges for market risk in addition to credit risk. Market risk is defined as “the risk of losses in on and off balance sheet positions arising from movements in market prices” (BIS, 1996). Market risk includes interest rate risk and equity risk (for trading book), foreign exchange risk and commodity risk. Banks are also allowed to use standardized approach and internal models approach (subject to certain conditions) for the measurement of capital charges. In addition, the definition of eligible capital to cover market risks is expanded. With the national discretion, banks may hold
20
Tier 3 capital which consists of short term subordinated debt in purpose of covering capital charges resulting from market risk.
Basel I helped to increase stability and soundness of the banking system. It provided level playing field for internationally active banks. Its simplicity made it easier for developing economies to adopt Basel I (Yayla and Kaya, 2005). However, “one size fits all” approach and simplicity bring some criticism, especially from international market players and academia. After the financial crises in the late 1990‟s (e.g. Asian financial crisis and Russian financial crisis), risks in the banking system became more complex and challenging. Although, the inclusion of market risk into Basel framework and other amendments made Basel I more risk sensitive, it did not include interest rate risk in the banking book, operational risk, etc. Therefore, the Basel Committee decided to establish a new capital adequacy framework to mitigate existing weaknesses and enhance Basel I.
Following an extensive consultation process with the industry between 1999 and 2003, the revised international capital framework, Basel II, was published on June 2004. Then the comprehensive version of the international capital standard, which consists of June 2004 Basel II framework with its update in 20053 and the remaining elements of Basel I
framework, arose.
3 In 2005, there was an update to the 2004 version of Basel II. The update was about the
treatment of double default effects (default of borrower and guarantor on the same obligation) and application of Basel II to exposures stemming from trading activities.
21
The minimum capital adequacy ratio of 8 percent, the basic structure of market risk which comes into force with 1996 amendment to the 1988 Basel Accord and definition of eligible capital are maintained in Basel II. Besides all these, there are fundamental changes in the Basel II framework. In addition to credit risk and market risk, the concept of operational risk is included in the measurement of banks‟ capital charges. The Basel framework describes operational risk as “the risk of loss resulting from inadequate or failed internal processes, people and systems or from external events” (BIS, 2004). In addition to the review of standardized approaches, internal rating based approaches are provided for each category of risk for larger and more sophisticated banks. The use of internal based approaches is subject to the approval of supervisory authority. Apart from the minimum capital adequacy requirements; Basel II framework underscores the importance supervision and market discipline. In this respect, there are three Pillars of the Basel II framework.
The first pillar is the calculation minimum regulatory capital requirements for credit risk, operational risk and market risk. Capital ratio is calculated as the regulatory capital divided by risk weighted assets. Capital is defined as Tier 1 capital and Tier 2 capital similar to 1988 Basel accord. Definition of Tier 3 capital, which includes short term subordinated debt, is also maintained to meet capital requirements arising from market risk. After deduction of some items from capital like goodwill, regulatory capital is reached. The second pillar of Basel II is built on supervisory review process.
22
The aim of Pillar 2 is to ensure that banks have enough capital for underlying risks and to encourage banks for better risk management. There are four main areas to be considered under Pillar 2. Supervisors are expected to assess the risks that are not fully captured under Pillar 1 requirement (e.g. credit concentration risk), risks that are not covered under Pillar 1 (e.g. interest rate risk in the banking book) and external factors to banks (e.g. impacts of business cycle). Supervisors should also examine whether banks meet the minimum standards and disclosure requirements relating to the use of advanced approaches in calculating credit risk, operational risk and market risk. The third pillar of Basel II develops disclosure standards. Thereby, market participants have the chance to assess the aspects relating to risk management and capital adequacy of banks, which increases the role of market participants to encourage banks to hold adequate level of capital for underlying risks.
Basel I and Basel II failed to prevent global financial crisis, as it is witnessed in 2008-2009. Excessive leverage of the banking system made global crisis more severe. The capital depleted gradually in quality and quantity. Banks did not have enough liquidity buffers. Therefore, the banking system was not able to absorb losses resulting from credit and trading activities. Banks‟ deleveraging process and the interconnectedness between banks exacerbate the impacts of crisis. In turn, taxpayers had to bear the losses due to the government interventions with capital and liquidity injections and guarantees. The global financial crisis demonstrated to the
23
standard setting bodies the existing weaknesses in the current system. Therefore, the Basel Committee introduced fundamental changes in the international regulatory framework on December 2010 with a revised version revealed on June 2011 (Basel III).
The Basel III can be described in the following six blocks: 1) Higher quality and higher level of capital
2) Better risk coverage
3) Capital buffers above the regulatory minimum to be built-up in good times
4) Non-risk based leverage ratio to serve as a backstop to risk-based capital requirement and to contain the built up of excessive leverage
5) Global liquidity standards to promote the short-term resilience of a bank‟s liquidity risk profile and to reduce funding risk over a longer time horizon
6) Stronger standards for supervision, risk management (Pillar 2) and public disclosures (Pillar 3)
The Basel III regulatory capital consists of common equity Tier 1 capital (e.g. common shares and retained earnings) and additional Tier 1 capital (e.g. subordinated debt with no maturity) and Tier 2 capital (e.g. loan loss provisions and subordinated debt with a minimum original maturity of at least five years). For each category, a set of criteria is defined for
24
instruments issued by the bank to be included in the relevant category. Thereby, the international consistency of definition of capital is enhanced. Tier 3 capital in Basel II is abolished.
There is greater focus of Basel III capital reforms on the common equity which is the highest quality of bank capital and has a better loss absorbing capacity. The Committee introduces more stringent definition of common equity with deductions made from common equity instead of Tier 1 or Tier 2 capital. The minimum common equity Tier 1 ratio increased from 2 percent to 4.5 percent. In addition, capital conservation buffer which comprises of common equity of 2.5 percent of risk-weighted assets produces the total common equity Tier 1 ratio of 7 percent. Moreover, countercyclical capital buffer is introduced within a range of 0-2.5 percent comprising common equity to be imposed when there is excess credit growth. Tier 1 capital ratio must be at least 6 percent of risk weighted assets (an increase of 2 percentage points from 4 percent requirement in Basel II). The total minimum capital adequacy ratio is unchanged with 8 percent.
3.2 Compliance to Basel Rules in Turkey
4In Turkish Legislation, the first regulation that adopts 1988 Basel Accord was issued in official gazette on 26 October 1989. Communiqué No: 6 explain the definitions relating to the standard ratio of capital base over risk weighted assets and contingencies, implementation rules, risk weights and
4 Information in this part is gathered from Kulahi, et al. (2013) and Banking Regulation and
25
minimum requirements. The capital is defined in terms of Tier 1 and Tier 2 capital. The minimum standard ratio is determined as 8 percent. A transitional arrangement adopted starting with a minimum standard of 5 percent in 1989 and 8 percent in 1992 with 1 percentage point increases each year. The Communiqué No: 6 was replaced on 9 February 1995 with the Communiqué No: 12. The Communiqué No: 12 requires banks to fill the templates relating to capital base/risk weighted assets and contingencies quarterly and report in the following one and a half month to the Undersecretariat of Treasury. There were also two additional ratios in the template: (i) Tier 2 capital over Tier 1 capital (ii) Subordinated debt over Tier 1 capital.
The Communiqué No: 12 was abolished on 30 June 1998 with the issuance of Communiqué on the Principles and Procedures on Measurement and Evaluation of Capital Adequacy of Banks. This Communiqué required banks to meet the minimum ratio of 8 percent both on a consolidated and unconsolidated basis. Moreover, there were two additional topics. The first one was the description of market risk as a potential risk in addition to credit risk and the second one was the definition of Tier 3 capital.
With the amendment of Banking Law on 18 June 1999, core principles for effective banking supervision issued by the Basel Committee were included in the Banking Law No: 4389. Thereby, it was aimed to enhance compliance of the banking system with international standards.
26
On 10 February 2001, the Regulation on the Measurement and Evaluation of Capital Adequacy of Banks was published by the Banking Regulatory Supervisory Authority, reflecting the 1996 amendment of Basel I. Therefore, market risk was included into the calculation of capital adequacy on 1 January 2002 on a non-consolidated basis and on 1 July 2002 on a consolidated basis.
The New Banking Law No: 5411 was published on 1 November 2005 in line with the Basel II criteria. The Law regulates the provisions relating to international financial regulations, risk management system, internal control system, internal audit system, and capital and liquidity adequacy in detail. In particular, capital adequacy appears in a separate article. Banks are made obliged “to calculate, achieve, perpetuate and report capital adequacy ratio, which shall not be less than eight percent” (Banking Law No: 5411, Article 45). Moreover, the Agency could differentiate the minimum capital requirements on a bank-by-bank basis.
The Regulation on the Measurement and Evaluation of Capital Adequacy of Banks was amended on 1 November 2006. One important modification that comes into force with this regulation is the inclusion of operational risk into the capital adequacy framework. In this respect, banks started to include operational risk into calculation of capital charges on June 2007. Moreover, Banking Regulation and Supervision Agency announced a target capital adequacy ratio of 12 percent in November 2006 following a prudential regulation. It is decided that banks that fall below 12 percent will
27
not be able to open new branches. On 28 June 2012, Turkish legislation becomes fully compliant with Basel II Capital Framework with the adoption of the new Regulation on the Measurement and Evaluation of Capital Adequacy of Banks.
On 5 September 2013, the Regulation Regarding the Banks‟ Equity is published and the definition of capital has been changed in line with the Basel III capital framework with the amendment of the Regulation on the Measurement and Evaluation of Capital Adequacy of Banks. These changes took effect starting from 1 January 2014. Moreover, the Regulation regarding the Capital Conservation Buffer and Countercyclical Capital Buffer is published on 5 November 2013. Turkish banks will start to hold capital conservation buffer in 2016 with a rate of 0.625 percent. The principles and procedures for the calculation of countercyclical capital buffer will be determined by the Banking and Regulation Supervisory Board.
28
Figure 3.1
Basel Rules Historically in Turkey
1989 1990 1991 1992 1993 1994 1995
.... 1998 1999 ... 2001 2002 ...
2005 2006 2007 ... 2012 2013 2014
Communiqué on the Principles and Procedures on Measurement and Evaluation of Capital Adequacy of Banks: minimum ratio
of 8 % both on a consolidated and unconsolidated basis & market risk as a
potential risk
Banking Law: 4389
The Regulation on the Measurement and Evaluation of Capital Adequacy of Banks: Capital charges for market
risk
Capital charges for market risk take effect Communiqué 6: The
first regulation that adopts 1988 Basel Accord, minimum standard of 5% Minimum standard of 6 % Minimum standard of 7 % Minimum standard of 8 % Communiqué 12: Reporting requirements to Undersecretariat of Treasury Banking Law: 5411
The Regulation on the Measurement and Evaluation of
Capital Adequacy of Banks: Capital charges for operational
risk
Capital charges for operational risk take
effect
Full compliance with Basel II
Basel III definition of capital and the Regulation
regarding the capital buffers
29
CHAPTER 4
LITERATURE REVIEW
There is both theoretical and empirical literature that provides evidence supporting the pro-cyclicality of capital ratios. As an earlier study in theoretical literature, Blum and Hellwig (1995) develop a macroeconomic model to investigate the role of regulatory capital requirements in fluctuations. They start with goods market equilibrium condition in which aggregate supply depends on price and wage and aggregate demand is the total of household and government expenditure, investment and a disturbance term. They assume that investment is a function of bank loans and retained earnings of firms, while bank lending depends on deposit demand, equity and bank regulation and banks do not issue new capital. Their model suggests that capital adequacy requirement exacerbates the pro-cyclicality of bank lending especially when the requirement is binding. With a shock to asset returns, banks face with the capital requirement. Then, they may cut lending, which will lead to reduction in aggregate demand through
30
reduced investment demand, which in turn affect the returns of banks‟ loans due to the firms inability to pay their debts. Following this work, other theoretical studies also predicts that regulatory capital requirements intensify the implications of exogenous shocks on lending and/or on business cycles.
With the introduction of Basel II, the relation between capital requirements and business cycles has received more attention. These studies provide further evidence for the pro-cyclical effects of Basel II capital requirements (e.g. Zicchino, 2006; for further literature Drumond, 2009). In a more recent study, Repullo and Suarez (2013) conduct a dynamic equilibrium model of lending relation to examine the effects of capital requirements on bank lending, bank failure probabilities and social welfare under several capital regulation frameworks. Their parameterization of the model shows that during boom periods or the times that economy exits from recession, Basel II framework result in larger expansion of credit supply, while it results in larger reduction of credit in vice versa states. Their conclusion implies that Basel II compared to Basel I might be amplifier of business cycles. Repullo (2013) develops a model of optimal bank capital regulation, in which banks‟ funding sources are uninsured deposits and equity capital. In the model, the regulator determines a capital adequacy requirement to maximize the social welfare function. The results indicate that if there is a negative shock to the aggregate supply of bank capital and the regulator keep the capital requirement fixed, a larger reduction in the
31
aggregate investment will occur compared to the case that the regulator lowers the capital requirements in bad times.
On the side of empirical studies, Kashyap and Stein (2004) look at the cyclical implications of Basel II capital standards. In order to do so, they estimate probability of default of a firm (borrower) with different methodologies and use internal ratings approach in the Basel framework to calculate its capital requirement. For the simulations, they consider the years 1998-2002 in which US and Europe experience recessions. They find evidence that there is an increase in capital requirements between the years 1998-2002 compared to the initial capital in 1998. They also differentiate their simulations according to the portfolio quality (investment grade vs non-investment grade) and region (North America vs Europe). Their simulations suggest that cyclicality of capital ratios may depend on portfolio type and credit risk models used to estimate default probabilities.
Most of the empirical studies on the pro-cyclicality of capital requirements focus on internal ratings based approaches. Unlike these studies, Segoviano and Lowe (2002) analyze how capital requirements would change over time (March 1995-December 1999) in Mexico using standardized approach and internal ratings based approach. They find that capital requirements would have increased over the two years following the 1994 crisis in Mexico and they would have declined as the Mexican economy start to recovery in the beginning of 1997. However, capital requirements calculated by standardized approach are less cyclical than those calculated
32
by internal ratings based approach. They concluded that increasing capital requirements for credit risk in downturns may have macroeconomic impacts through reduction in credit supply of banks. Carpenter et al. (2001) question whether the proposed Basel Capital Accord (Basel II) in 2001 to replace the 1988 Capital Accord implies additional cyclicality. They examine how capital required in standardized approach for commercial and industrial loans would change between the 1997-2000 using Moody‟s data for external ratings. Their finding is that standardized approach in proposed version of Basel II in 2001 does not create additional pro-cyclicality over the 1988 framework.
It is generally observed that banks hold regulatory capital above the minimum requirements. Therefore, majority of banks may not be capital constrained. This might be another factor that may affect the potential pro-cyclical effects of capital regulations. In fact, Heid (2007) concludes that the behavior of excess capital over the minimum capital requirements is important in assessing the fluctuation in bank lending. He finds that although Basel II will have pro-cyclical effects as it is the case in Basel I, capital buffers are likely to mitigate cyclical impacts.
Regarding the cyclical behavior of capital buffers, there are different results in the empirical literature across countries and/or banking groups. One of the first empirical evidence on the pro-cyclicality of capital buffers is provided by Ayuso et al. (2004). They provide evidence for the presence of significant negative relation between capital buffers and business cycle for
33
Spanish banks over the years 1986-2000. Lindquist (2004) find negative effect of real GDP growth on capital buffer for Norwegian banks during the period 1995:Q4-2001:Q4, although there is limited significant statistical evidence. In another study, Jokipii and Milne (2008) examine the relation between European Union banks‟ capital buffer and the cycle. Their sample consists of commercial, savings and co-operative banks over the years 1997-2004. They conclude that there is significant negative relation between the capital buffer and cycle, which is in line with the earlier literature. Considering the different sub-groups, capital buffer of co-operative banks demonstrate a positive co-movement with the business cycle contrary to commercial and saving banks. Moreover, large banks‟ and small banks‟ capital buffer vary differently over the business cycle, in which the latter shows positive relation.
For Germany, Stolz and Wedow (2011) find a negative but insignificant impact of cycle on capital buffer considering saving and co-operative banks during the period 1993-2004. When they decompose the state of the business cycle, they document evidence that capital buffers increase during economic downturns, while there is no significant relation during booms. Moreover, they provide evidence that there is a negative relation between capital ratios of low capitalized banks and cycle in both upturns and downturns. Shim (2013) and Garcia-Suaze et al. (2012) also verify that bank capital buffer fluctuate in the opposite direction with the
34
business cycle for US bank holding companies over the period 1992:Q1-2011:Q3 and Colombian banks between 1996 and 2010, respectively.
Apart from individual countries, the cross country analyses also provide evidence for the negative co-movement of capital buffers and business cycle. For example, Bikker and Metzemakers (2004) is the first study that compares the bank capital behavior across countries. They proxy capital ratios with two definitions: (i) equity to total assets (ii) capital to risk weighted assets. As a proxy of business cycle, they use GDP growth deviation from its country specific average. They conclude that there is statistically significant negative cycle effect on capital over risk weighted assets ratio for twenty nine OECD countries over the sample period 1992-2001. However, they find no statistical evidence for the cycle effect on equity to asset ratio. The results differ across various bank size classes. For both definitions of capital ratios, small banks show positive co-movement with the business cycle in contrast to large and medium size banks.
Just like Bikker and Metzemakers (2004), recent studies have documented evidence that the effect of business cycle on bank capital buffers may depend on the measure of capital ratios as well as indicator of the cycle. The empirical study of Guidara et al. (2013) includes three different capital ratios, which are measured as equity over total assets, capital to risk weighted assets and economic capital ratio using value-at-risk based on the bank‟s asset distribution. As a measure of cycle, they use output gap, which is defined as the cyclical component of the real GDP obtained by using HP
35
filter. Their sample covers the period 1982-2010 and they use quarterly data for the six largest banks in Canada. Unlike the previous literature, they document that banks‟ capital buffer exhibits positive co-movement with the business cycles in Canadian banking system, based on the leverage ratio as an indicator of capital ratio. They find no significant impact of business cycle on capital buffer when it is measured using either capital to risk weighted assets ratio or economic capital ratio (although the coefficient is negative). Brei and Gambacorta (2014) also analyze three capital ratios over the cycle: the new Basel III leverage ratio, the accounting leverage ratio (Tier 1 over total assets) and Tier 1 capital to risk weighted assets ratio. They examine how different capital ratios behave differently over three cycle indicators; namely, nominal GDP growth, real GDP growth and credit to GDP gap. They use internationally active banks in fourteen advanced economies for the period 1995-2012. Considering three cycle measures, they find negative co-movement between the capital ratios and cycle, where Basel III leverage ratio behave more countercyclical than the other two ratios. During crisis period (2008-2012), all three capital ratios behave less countercyclically over the cycle, although the relation is only statistically significant when the credit to GDP gap is used.
36
CHAPTER 5
DATA AND METHODOLOGY
5.1 Econometric Model
In this study, I examine how bank capital ratios behave in response to the changes in business and financial cycles in Turkey using the methodology of Brei and Gambacorta (2014). More precisely, the empirical model can be formulated as follows:
( )
( ) ( )
where the dependent variable refers to either capital adequacy
37
business cycle or financial cycle. In order to capture how the cyclicality of capital ratios changes during normal times and crisis times, a dummy variable, for crisis period is created. Several balance sheet characteristics of banks, , which might affect bank capital, are also
controlled. These characteristics are credit risk (non-performing loans over total loans), size (natural logarithm of banks‟ total assets), profitability (ROA), funding structure (non-deposit funding or deposit funding) and liquidity (liquid assets over total assets). I also include dummy variable, to control the effects of changes in Turkish banking legislation during the sample period, 1993:Q4-2014:Q3. The lagged dependent variable is a measure of short-term adjustment costs. Adjustment costs may be relevant due to the information asymmetries between investors and issuer, which makes it harder to raise capital in a short term (Myers and Majluf, 1984). Finally, the variable captures the bank fixed effects and
indicates the error term in the model.
Overall, using the above empirical model, I aim to answer the following questions:
1) How do capital ratios of banks‟ operating in Turkey behave over the cycle during 1993:Q4-2014:Q3?
2) How does this relation change during the sub-period of 2003:Q1-2014:Q3?
3) Does the behavior of banks‟ capital ratio vary according to the definition of capital ratios (e.g capital adequacy ratio and balance
38
sheet leverage ratio) and cycle (e.g. business cycle and financial cycle)?
4) Does the behavior of banks‟ capital ratios change during crisis periods?
5) How do capital ratios of banks change according to the bank characteristics?
6) Are banks‟ capital ratios sensitive to the changes in regulations? My model has a possible problem of endogeneity. The capital held may affect the risk profile of banks in addition to that risk profile of banks may be a determinant of bank capital. Moreover, the state of the banking sector may impact the business cycle and financial cycle as remarked by Brei and Gambacorta (2014). I try to mitigate this endogeneity problem in two ways. First of all, I estimate the econometric model by System Generalized Method of Moments (System-GMM) dynamic panel methodology developed by Blundell and Bond (1998). I instrument exogenous variables by themselves and endogenous variables by their lags in levels. Secondly, I use bank specific characteristics in their one-period lags as in Brei and
Gambacorta (2014).
5.2 Data
I use an unbalanced bank-level panel data for deposit banks in Turkey. I obtained data from the database of Central Bank of the Republic of Turkey. The main sources for the data used in this study are banks‟ balance
39
sheet, income statements and regulatory templates for capital adequacy, which are reported regularly to the Central Bank of the Republic of Turkey and Banking Regulation and Supervision Agency. Moreover, I use the database of Turkish Statistical Institutes and Bank for International Settlements for macroeconomic and financial indicators.
My data adopt a quarterly frequency. It covers eighty-two quarters from 1993:Q4 to 2014:Q3. The sample of banks includes public banks, private banks and foreign banks. I exclude investment and development banks and participation banks from the sample as each bank type has different business models. Banks under the control of Saving and Deposit Insurance Fund (SDIF) are also excluded from the sample since these banks cannot extend credits and exercise standard banking activities. After all, 65 banks are analyzed in this study.
Dependent and Explanatory Variables
Capital Ratios
Similar to Guidara et al. (2013) and Brei and Gambacorta (2014), I consider two capital ratios to understand whether cyclicality of capital ratios depends on how capital ratio is measured:
1) Capital adequacy ratio based on Basel Framework 2) Balance sheet leverage ratio
40
Capital adequacy ratio is calculated as the regulatory capital divided by the total risk weighted assets (BCBS 1988, 2006, and 2010). Balance sheet leverage ratio corresponds to the equity divided by assets.
I also include lagged dependent variable into my models to capture the effect of short term adjustment costs. Adjustment costs may be relevant due to the information asymmetries between investors and issuer, which makes it harder to raise capital in a short term (Myers and Majluf, 1984)
Cycle
I consider two cycle indicators in my analysis:
1) Real GDP growth rate as a measure of business cycle. 2) Private credit to GDP gap as a measure of financial cycle.
Thereby, I aim to capture how capital ratios react to the changes in both economic and financial environment. Private credit to GDP gap indicates the difference between the private credit to GDP ratio and its trends. I apply one-sided Hodrick-Prescott filter with a smoothing factor lambda of 400000 to find the cycle and trend components in line with the Basel III guidelines for the countercyclical capital buffer5.
Credit risk
I use the ratio of non-performing loans to total loans as a measure of risk profile of banks (see among others Shim, 2013; Jokipii and Milne, 2008).
41
This is an ex-post credit risk and can be regarded as a good pointer of asset quality of banks.
If banks hold more risky assets, they are likely to keep higher capital to withstand losses in the event of defaults. Therefore, if banks adjust their capital in line with the riskiness of their portfolio; I expect a positive relation between risk measure and capital ratios.
Size
Bank size is measured as a natural logarithm of total bank assets6. I
also created two dummy variables, namely large and small. Dummy variable for large banks takes value 1 for the top seven banks in Turkey, as of December 2014. Dummy variable for small banks takes value 1 if the natural logarithm of total bank asset is in the lowest decile.
In the literature, there are two hypotheses about the relation between size and capital. In the first case, large banks may hold higher capital due to their complex structure and importance of asymmetric information (Gropp and Heider, 2010). On the other hand, according to the too-big-to-fail hypothesis, large banks may hold less capital than other banks. They believe that they will take government support in the event of failure because their failure would cause significant disruption to the financial system and real sector. Moreover, as large banks would be more diversified and have more access to the capital markets, they could have less capital.
42
In line with the second view, I expect a negative relationship between bank size and capital ratios due to the too-big-to-fail hypothesis for large Turkish banks.
Profitability
I use return on assets to measure the bank profitability. If profitability measures reflect the direct cost of remunerating, banks may have less capital. Moreover, if profitable banks face lower cost of issuing equity, they may prefer to hold lower capital buffers. On the other side, banks may increase capital through retained earnings because raising equity is more costly than external financing (Myers and Majluf, 1984). Therefore, the direction of the relationship between profitability and capital ratios is ambiguous. In this study, I have also no expectation on the direction of the relation for Turkish banks during the sample period.
Funding Structure
I consider funding structure in two aspects: (I) wholesale funding; (II) deposit funding. I use the ratio of non-deposit non-equity liabilities over total assets as an indicator of wholesale funding. I calculate deposit funding as the ratio of deposits to total assets.
The sign of the coefficient is uncertain. If banks have greater access to the capital markets and have greater funding capability, they may choose to hold lower capital buffers. On the other hand, if banks rely on more