Macroeconomics of Climate Change in a Dualistic Economy Copyright © 2018 Elsevier Inc.
http://dx.doi.org/10.1016/B978-0-12-813519-8.00003-0 All rights reserved. 65
Energy and Environmental Policy
Against Climate Change in Turkey
3.1 STATISTICS ON ENERGY AND ENVIRONMENT
IN TURKEY
Economic growth in Turkey has generally not been decoupled from resource use, energy depletion, and environmental degradation. A United Nations report (UN, 2013, p. 3) highlighted that “the present dominant model of development is facing simultaneous multiple crises such as depletion of natural resources and the market failures that have already marked the first decades of the current millennium.” Therefore this model of economic growth has been ineffective at enabling productive and decent employment, and has exacerbated the phenomenon of climate change, with its various facets including the depletion of natural resources, the loss of biodiversity, an energy crisis, and food security. In contrast, the report underlined that the “green economy concept proposes to break away from the not very ef-fective current model of development and move towards a more sustainable development paradigm that is merely characterized by low-carbon emis-sions, rational use of resources and social inclusiveness.” These observations are central to green growth, a relatively new concept that has captured the attention of global policy makers, researchers, and civil society organizations, which could help design and evaluate policies that can efficiently achieve environmental sustainability. This is of particular interest to fast-growing emerging market economies, which are characterized by rapidly increasing ecological footprints, and which seek to decouple economic growth from rising energy use and pollution. The lack of such decoupling is observable in Turkey.
3.1.1 Energy Stats
As a developing middle-income country, Turkey has increased its use of electricity and primary energy sources. Turkey’s GDP, total energy con-sumption (oil equivalent), and greenhouse gas (GHG) emissions increased by 1.5-, 1.36-, and 1.13-fold, respectively, from 1990 to 2014. The speed of emission growth has increased since the beginning of the 2000s; however,
energy consumption and GHG emissions per GDP decreased slightly. Esti-mates from the Ministry of Energy and Natural Resources (MENR) indi-cate that per capita energy use rose from 1241 kg of oil equivalent in 2005 to 1648 kg of oil equivalent in 2015. The total energy demand currently (2015–16) stands at 135.3 million tonnes of oil equivalent.
These statistics hint at a significant projected expansion of energy de-mand over the next decade. The Turkish Electricity Transmission Company (TEIAS, 2013) estimated that energy demand will continue to increase by 6%–7% annually until 2023; however, this projection is criticized among scholars due to the highly optimistic economic growth assumption used. Official figures project substantial pressures for the continual increase in en-ergy demand, with installed capacity expected to grow from 64 to 120 GW between 2014 and 2023. The underlying implication of such an expec-tation is that the Turkish economy has not attained stability with respect to its energy demand per capita. Hence supporting the expected level of growth is in itself a challenge that will require significant investments in generation capacity and energy infrastructure, as well as continuation of the energy market reforms initiated in the 2000s.1 The country’s total energy use is still relatively low [approximately one-third of the organization for economic cooperation and development (OECD) average], although it is increasing at a fast pace. The International Energy Agency (IEA, 2013b) predicts that energy use in Turkey will double over the next decade, while electricity demand growth is expected to increase at an even faster pace. Natural gas demand is also expected to increase with the MENR predicting a compound annual growth rate of 2.9% until 2020.
If the forecasted levels of energy demand and energy use are to be attained, Turkey will need to significantly invest in its energy infrastruc-ture. In addition, further investments in the renewable energy sector will also be required to harness the potential of solar and wind power. Con-versely, 0.9% of the world total primary energy supply (TPES) is pro-duced in Turkey, which corresponds to a share of 2.3% of OECD’s TPES. However, Turkey’s TPES/USD 1000 GDP is below other OECD countries
1 In 2001 Turkey commenced a broad electricity reform program with the enactment of the Electricity Market Law (Law No. 4628). This law established a “new and radically differ-ent” legal framework for the design of electricity markets, and constituted an independent Energy Market Regulatory Authority (EMRA). Further changes in the electricity market brought about the fragmentation of state-owned enterprises into different entities (i.e., generation, transmission, distribution, wholesale, and retail supply), as well as the introduc-tion of a competitive wholesale electricity market in 2006.
such as Mexico, Hungary, Latvia, Poland, and South Korea (Fig. 3.1). The bulk of the country’s TPES (around 90%) still originates from fossil fuels and the rest comes from renewable energy sources; natural gas and coal are the main sources of primary energy.
Turkey’s energy composition in the mid-2000s saw a decreased contri-bution from solid fuels and petroleum and an increased contricontri-bution from natural gas and renewable energy sources. The contribution of natural gas rose from 5.3 to 32.5% between 1990 and 2014, and the contribution of renewable energy rose from 0.8 to 4.5%. The use of petroleum declined from 45.4 to 26.2% in this same time period. Natural gas produces fewer emissions per unit in comparison to solid fuels; however, as a fossil fuel it is not environmentally friendly. During 1971–90 there was a slight increase in the share of renewable energy in Turkey, but fossil fuel use also increased by 70%. However, renewable energy supplies increased by 20% in the first decade of 2000 (Fig. 3.2). Fossil fuels are still the main source of energy despite the recent acceleration in renewable energy.
Turkey has huge potential to exploit renewable energy sources; how-ever, with the exception of small hydropower plants (SHPPs) and wind power plants, this remains relatively untapped. Turkey ranks seventh in the world and first in Europe in terms of geothermal energy potential Figure 3.1 Total primary energy supply (toe/1000 USD) in the OECD, 2015. Toe, Tonnes
of oil equivalent. (Data taken from OECD, 2017. Primary Energy Supply (indicator). doi:10.1787/1b33c15a-en).
(Herdem Attorneys at Law, 2013), with a technical potential of 1500 MW (Baris and Kucukali, 2012). In terms of solar energy, the country has a po-tential of approximately 3,871,472 MW, while biomass and SHPPs have potentials of 15,995 and 6849 MW, respectively (Benli, 2013). Turkey was listed alongside China, the United States, Germany, and Brazil in a list of the top five countries with solar heat capacity (Ren21, 2013), and was ranked second for annual investments, additions, and production of hydropower capacity and solar water collection (heating) capacity in 2012.2 Further-more, Turkey also has one of the highest potentials (114,173 MW) for wind energy in Europe (Baris and Kucukali, 2012). According to the IEA (2013a), wind power projects are successfully competing with subsidies against fossil fuel-based power projects in wholesale electricity markets.
Significant barriers impede the increased use of renewable energy in Turkey. The three general barriers that delay the increased utilization of renewable energy in Europe, Central Asia (Schreiber, 2004, p. 197), and Turkey are:
• the lack of expertise and know-how about renewable energy among energy sector decision makers at government, industry, and local con-sulting services levels;
• energy market issues including distorted energy policies (e.g., high subsidies for fossil fuels, energy tariffs not covering costs, lack of syn-chronization between various environmental support programs, and
2 Based on absolute amounts of investment, power generation capacity, or biofuel production.
Figure 3.2 Electricity output (GWh) from fossil fuels versus renewable resources,
the frequent crowding out of potential support by excessive national subsidies) and inadequate and nontransparent legal, regulatory, and insti-tutional frameworks, which leads to uncertainties in the heat and power industry, and to a bias in favor of fossil fuels; and
• high transaction costs due to the typically small size of renewable energy projects compared to large fossil fuel-based projects.
The energy demand across sectors is variable. According to Turkish Sta-tistical Institute (TURKSTAT), the share of electricity production and dis-tribution in sectoral energy demand increased to 42.4% in 2014. The en-ergy demand of the transport and storage sectors reached 9.5% in the same year, while the energy consumption share for the manufacturing industry was 38.4%.
As a result of the increased energy use in energy-intensive sectors, energy imports have risen tremendously and have become an important element of the current account deficit. Turkey has no major oil or gas re-serves, therefore it is highly dependent on energy imports (which account for approximately 80% of the total supply) and is highly exposed to the challenge of energy insecurity (Yuksel, 2013). In 2012 Turkey imported 3,980,270 TJ of energy, accounting for around 80% of the total energy supplied that year. The country mostly produces hard coal and lignite; however, domestic consumption is covered by a limited amount of do-mestic coal production as the extracted reserves are of low quality. Import figures are the highest for oil, followed by natural gas and coal. In 2012 one import of natural gas corresponded to 98% of total domestic demand. Russia and Iran were the main suppliers of oil and natural gas for the same year (IEA, 2013b).
3.1.2 Emissions Stats
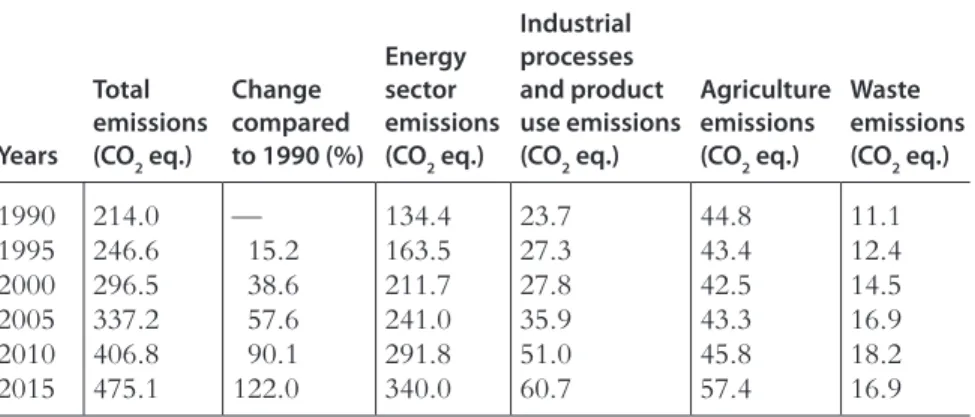
In 2015 Turkey’s per capita emissions of carbon dioxide (CO2) and other GHGs (CO2 eq.) stood at around 6 tons, while its total CO2 eq. emissions per GDP (in constant USD) reached 0.524 kg. Therefore Turkey displays rel-atively lower emission figures in comparison to global and OECD averages. However, Turkey is cited in the top five countries with the fastest growth of aggregate CO2 eq. emissions, which increased from 214 to 475 million tons between 1990 and 2015 (a cumulative increase of 122%; Table 3.1), and is expected to increase to 675 million tons by 2030 (Acar and Yeldan, 2016). This suggests that Turkey will be on a divergent trend to many of the emerging market developing economies, as well as the world average, over the coming decades.
According to TURKSTAT (2017), CO2 emissions from the energy sec-tor have more than doubled since 1990 and are expected to rise signifi-cantly in the medium and long term due to the increasing energy demand. In 2015 the energy sector was the main contributor (71.5%) to total GHG emissions, followed by industrial processes (13%), agriculture (12%), and waste (3.5%).
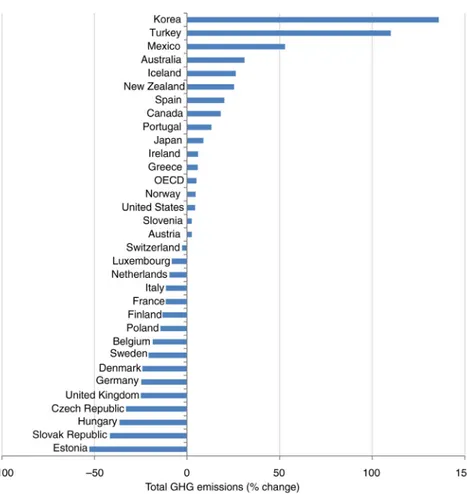
Among the OECD countries, Turkey ranked second (after Korea) in terms of the growth rate of GHG emissions during 1990–2012. Fig. 3.3 demonstrates that almost half of all OECD economies experienced nega-tive changes in their emissions during the same period.
3.2 EXISTING ENERGY AND ENVIRONMENTAL
POLICIES IN TURKEY
Turkish energy policies are currently based on the depletion of all domes-tic coal reserves by the end of 2023, and will subsequently be driven by a switch to nuclear energy, which will be activated by the end of the 2020s. However, two points are missing in this trajectory: (1) an environmentally sensitive regional development perspective, and (2) strategic concern for climate change abatement or mitigation.
Nevertheless, these are common strategic policies for many develop-ing economies. Many think that developdevelop-ing countries cannot be asked to reduce emissions until developed countries have done so. The problem of climate change originated from industrialized countries releasing vast levels of GHG emissions, and hence developing countries cannot be held Table 3.1 Greenhouse gas emissions by sectors, 1990–2015
Years Total emissions (CO2 eq.) Change compared to 1990 (%) Energy sector emissions (CO2 eq.) Industrial processes and product use emissions (CO2 eq.) Agriculture emissions (CO2 eq.) Waste emissions (CO2 eq.) 1990 214.0 — 134.4 23.7 44.8 11.1 1995 246.6 15.2 163.5 27.3 43.4 12.4 2000 296.5 38.6 211.7 27.8 42.5 14.5 2005 337.2 57.6 241.0 35.9 43.3 16.9 2010 406.8 90.1 291.8 51.0 45.8 18.2 2015 475.1 122.0 340.0 60.7 57.4 16.9
responsible. The developing world would like to see industrialized coun-tries committing to reduce emissions before they take any climate action themselves.
We will provide examples of climate policy in the developing world in the upcoming sections; however, this section is mainly devoted to examin-ing tools and policies in relation to energy and climate change in Turkey. Instruments of energy and environmental policy in Turkey have thus far mainly consisted of carbon tax-cum-subsidies and the administration of high taxes on energy market users and suppliers.
Figure 3.3 Change (%) in total greenhouse gas emissions of OECD countries, 1990–2012. (Data taken from OECD, 2014. Greenhouse Gas Emissions by Source and the OECD Environ-ment Statistics database. doi:10.1787/data-00594-en. UNFCCC, Greenhouse Gas Inventory Data (2014)).
3.2.1 Energy-Related Policies
Turkey is grappling with the challenge of providing a cost-competitive en-ergy supply for its population and industrial sector while simultaneously ensuring energy security. Although the country does not have a national energy strategy plan, the MENR created institutional strategic plans to cover the periods 2010–14 and 2015–19. The common objectives of the corresponding plans were:
1. to secure an energy supply by giving priority to domestic resources, by increasing the share of renewable energy resources, by increasing energy efficiency, by making the free market conditions operate fully, by im-proving the investment environment, and by diversifying resources in the areas of oil and natural gas;
2. to enhance Turkey’s influence in regional and global energy by turning the country into an energy hub and terminal using the geostrategic position effectively within the framework of regional cooperation processes;
3. to minimize the negative environmental impacts of energy and natural resource-related activities;
4. to increase the contribution of natural resources into the national econ-omy; to increase the production of industrial raw materials, metals, and nonmetal mineral reserves; and to utilize these on a national scale; and
5. to increase the effectiveness of managing energy and natural resources, and to become a pioneer and supporter of innovation in energy and natural resources.
In addition, Turkey aims to gradually develop nuclear power capaci-ties with a view to reducing its dependency on imported fossil fuels and meeting the growing energy demand. It plans to achieve a nuclear capacity of over 10,000 MW by 2030, and has started cooperating with Russia in the construction and operation of a nuclear power plant. A second nuclear power plant is planned for Sinop and a third project is under discussion.
Fossil Fuel Subsidies: Coal, Oil, and Gas
In order to meet its rising energy demand and decrease its dependence on energy imports, Turkey has supported the coal sector with generous sub-sidies, which range from direct transfers from the treasury to government support for coal exploration. In 2012 the country introduced an investment incentive scheme, which contained various instruments to support new coal mining and power generation projects depending on the region that the
investment was to take place. However, these subsidies have the potential to compromise the environment, disrupt the development of low-carbon technologies, and undermine public finances. Previous work by the Global Subsidies Initiative and their Turkish partners (Acar et al., 2015) established a detailed understanding of the current level of knowledge around the role of subsidies to the coal industry, and they identified particular subsidies for which direct cost estimates were not available. Available rudimentary data revealed that quantifiable subsidies to the coal sector result in a per kWh subsidy of around USD 0.01, which increases to USD 0.02 when consumer subsidies are included. A total of USD 730 million was given to the coal sector in the form of subsidies in 2013 (Acar et al., 2015, p. 10). When in-cluding the exploration subsidies for oil and gas, the sum (USD 1283 mil-lion) represents approximately 0.16% of Turkey’s nominal GDP in 2013.
In order to assess the effects of the existing coal subsidization scheme on emissions, energy security, economic and social costs, income, employment, and economic growth, Acar and Yeldan (2016) conducted an applied gen-eral equilibrium analysis. They established that if coal production and in-vestment subsidies were eliminated by 2030, CO2 emissions would decrease significantly in both high- and low-income regions of Turkey. Such a policy change would bring about a 5.4% decrease in emissions by 2030 compared to the base path. Given that the coal sector comprises only a small portion of the sectoral production of the country, it is clear that eliminating coal subsidies would be significantly beneficial in terms of combating environ-mental pollution and climate change. Existing coal subsidies compromise the competitiveness of renewable energy technologies and jeopardize re-newable energy investments, as well as making the energy system dependent on fossil fuel-based energy (i.e., “lock-in”) (Bridle and Kitson, 2014).
Renewable Energy Policy
Turkey enacted its first specific law regarding renewable energy, the Utiliza-tion of Renewable Energy Sources for the Purpose of Generating Electrical Energy (the Renewable Energy Law, No. 5346), on May 18, 2005. This was a key step towards strengthening the country’s renewable energy sector and meeting the growing energy demand. The law stated that the legal entity holding a generation license shall be granted a “renewable energy resource (RES) certificate” by EMRA for the purpose of monitoring the domestic and international markets of RES-generated electricity. Furthermore, this law provided feed-in tariffs, which were purchase guarantees until 2011.
It allowed entities generating renewable energy to rent state territories or provided the right to access (or permission to use) these territories.
An amendment to the Renewable Energy Law was later introduced to improve the incentives and encourage renewable energy investment in Turkey. New favorable tariffs were introduced for the sale of electricity generated by renewable energy sources, as well as further feed-in tariffs3 that were available for 10 years from commissioning of the plant. Table 3.2 displays the current levels of feed-in tariffs offered to renewable energy pro-ducers in Turkey. Solar power and biomass projects receive the highest feed-in tariffs (13.3 US¢/kWh), while hydropower and wfeed-ind power producers are granted 7.3 US¢/kWh. Those projects that use domestic equipment for electricity production are also rewarded with local production premium support, which is determined by the type of energy source. The maximum amount of support may reach up to 22.5 US¢/kWh for concentrating solar power projects.
In accordance with the strategy plans and Renewable Energy Law, the country is hoping that 30% of power generation will come from renewable sources by 2023. The government aims to achieve 20,000 MW of installed wind capacity, 600 MW of installed solar power capacity, and full utilization of its hydro potential by 2023.
3.2.2 Environmental Policy
Turkey’s climate change policies are set out in the National Climate Change Strategy (2010–23) and the National Climate Change Action Plan (2011–23). The former identifies actions against climate-related outcomes Table 3.2 Feed-in tariffs for renewable energy in Turkey
Energy types Tariff (US¢/kWh) Local production premium (US¢/kWh) Maximum tariff (US¢/kWh) Hydro 7.3 2.3 9.6 Wind 7.3 3.7 11.0 Geothermal 10.5 2.7 13.2 Biomass 13.3 5.6 18.9 Solar photovoltaic 13.3 6.7 20.0
Concentrating solar power 13.3 9.2 22.5
Source: Amending Law to the Renewable Energy Law (December 29, 2010) Law No. 6094.
3 Feed-in tariffs are fixed cash per kWh payments that were determined by an administrative body and generally available for eligible energy producers.
and sets carbon intensity reduction targets and emission reduction targets (for CO2) from the energy sector (i.e., a 7% reduction of 1990 levels by 2020). However, while Turkey is a signatory to the Kyoto Protocol, it re-mains the only OECD country without a national GHG emissions target, and has not made a commitment to reducing GHG emissions by 2020. The country is still to take a clear and strong position.
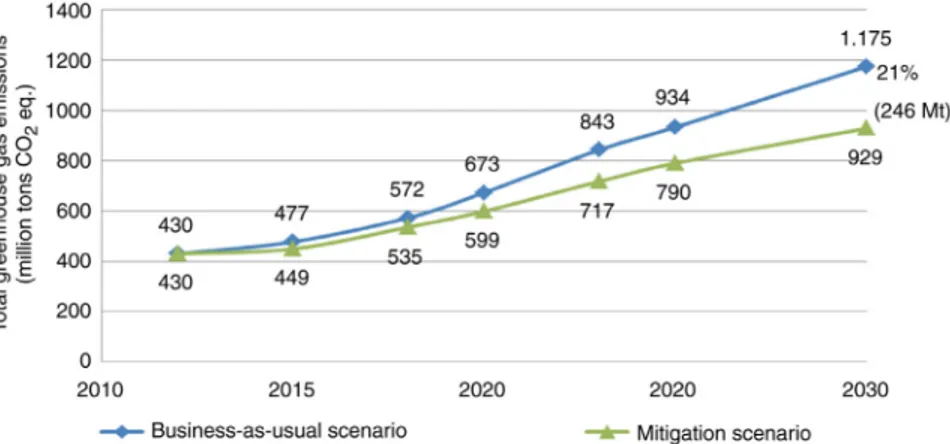
The most up-to-date document that sets out Turkey’s national emis-sion reduction target is the intended nationally determined contributions (INDC) document, which was submitted to the UNFCCC Secretariat on September 30, 2015, prior to the Conference of the Parties (COP) 21 meeting in Paris. This document summarizes Turkey’s national situation and emphasizes its status as a country with special circumstances (a sta-tus recognized by decision No. 1/CP.16 of the UNFCCCs Annex 1). The document states that Turkey defines its emission reductions and adaptation strategies within this framework. In this document, which is intended to be implemented in 2012–30, Turkey declares its commitment to reduce the 1175 million tons of CO2 eq. GHG emissions predicted under the base scenario, to 929 million tons by 2030 (a reduction rate of 21%). It states that, in doing so, an important step will have been taken towards low-carbon development with a view to achieving the 2°C global target.4
The INDC declaration also cites plans and policies that will be adapted for emission-intensive sectors. However, the declaration includes no data or projections regarding the emission reductions that these policies and mea-sures are expected to deliver in comparison to those predicted under the business-as-usual (BAU) scenario in the 2021–30 period. Box 3.1 includes the main targets established in these key plans and policies. Emission reduc-tions to be achieved by the abovementioned policies and plans compared to the BAU scenario are presented in Fig. 3.4.
In order to meet the targets set forth by the national contribu-tion document, it may be useful to go through the existing relevant national and sectoral plans and policy frames (i.e., the Tenth Develop-ment Plan (2014–18), National Climate Change Strategy (2010–23), Climate Change Action Plan (2011–23), Industrial Strategy Document (2015–18), Energy Efficiency Strategy Document (2012–23), Electric Energy Market and Security of Supply Strategy Document (2009), and strategic plans of other relevant ministries). Even though the targets and
4 Republic of Turkey Intended Nationally Determined Contribution. Available from: https://
BOX 3.1 Key plans and policies for mitigation
Energy
•
Increasing electricity production capacity from solar power to 10 GW by 2030.•
Increasing electricity production capacity from wind power to 16 GW by 2030.•
Tapping the full hydroelectric potential.•
Commissioning a nuclear power plant by 2030.•
Reducing electricity transmission and distribution losses to 15% by 2030.•
Rehabilitating public electricity generation power plants.•
Establishing microgeneration and cogeneration systems and producing on-site electricity.Industry
•
Reducing emission intensity with the implementation of the National Strategy and Action Plan on Energy Efficiency.•
Increasing energy efficiency in industrial installations and providing finan-cial support to energy efficiency projects.•
Performing studies to increase the use of waste as an alternative fuel for appropriate sectors.Transport
•
Ensuring a balanced utilization of transport modes in freight and passenger transport by reducing the share of road transport and increasing the share of maritime and rail transport.•
Enhancing combined transport.•
Implementing sustainable transport approaches in urban areas.•
Promoting alternative fuels and clean vehicles.•
Reducing fuel consumption and emissions of road transport with the National Intelligent Transport Systems Strategy Document (2014–23) and its Action Plan (2014–16).•
Realizing high-speed railway projects.•
Increasing urban railway systems.•
Saving fuel using tunnel projects.•
Removing old vehicles from traffic.•
Implementing green port and green airport projects to ensure energy efficiency.•
Implementing special consumption tax exemptions for maritime transport.Buildings and Urban Transformation
•
Constructing new energy-efficient residential and service buildings in accordance with the Energy Performance of Buildings Regulations.•
Creating energy performance certificates for new and existing buildings to control energy consumption and GHG emissions and to reduce energy con-sumption/m2.•
Reducing the consumption of primary energy sources in new and existing buildings through design, technological equipment, and building materials, and developing channels that promote the use of renewable energy sourc-es (e.g., loans and tax reductions).•
Disseminating green building, passive-energy, zero-energy house designs to minimize the energy demand and ensure local production of energy.Agriculture
•
Saving fuel through land consolidation in agricultural areas.•
Rehabilitating grazing lands.•
Controlling the use of fertilizers and implementing modern agricultural practices.•
Supporting minimum tillage methods.Waste
•
Sending solid wastes to managed landfill sites.•
Reusing, recycling, and using other processes to recover secondary raw materials to use as energy source or to remove wastes.•
Recovering energy from waste using processes such as material recycling of wastes, biodrying, biomethanization, composting, advanced thermal processes, or incineration.•
Recovering methane from landfill gas from managed and unmanaged landfill sites.•
Utilizing industrial wastes as alternative raw materials or fuels in other industrial sectors through an industrial symbiosis approach.•
Conducting relevant studies to utilize wastes generated from breeding and poultry farms.•
Rehabilitating unmanaged waste sites and ensuring wastes be deposited at managed landfill sites.Forestry
•
Increasing sink areas and preventing land degradation.•
Implementing the Action Plan on Forestry Rehabilitation and National Af-forestation Campaign.policies set forth in these documents, which form the basis of the INDC, refer to such keywords as environmental awareness, climate change, clean production, and resource efficiency, the contributions of these policies to reducing emissions or protecting the environment are not expressed in quantitative terms. More quantifiable data is needed in order to evaluate the adequacy of the INDC.
3.3 POSSIBLE EXTENSIONS OF ENVIRONMENTAL
POLICY IN TURKEY
In environmental economics literature, two main instruments stand out as market-based mechanisms (MBMs) that can be implemented against cli-mate change: (1) quota allocation-based emission trading systems (ETS) and voluntary carbon markets; and (2) taxation (e.g., carbon tax) or subsidies (e.g., energy efficiency subsidies, subsidies for renewable energy technolo-gies, or guaranteed purchases for renewable energy).5
The most prominent practice of ETS was designed by EU members within the scope of the Kyoto Protocol. In addition, energy efficiency cer-tificates (white cercer-tificates) and renewable energy trading systems also exist, which aim to encourage energy efficiency and the use of renewable energy sources. New practices may be added to these in line with evolving market conditions.
Figure 3.4 Greenhouse gas emissions in the mitigation versus business-as-usual
sce-nario, according to the INDC of Turkey. (UNFCCC. Intended Nationally Determined
Contri-bution (Turkey)).
5 We widely benefited from Yeldan et al. (2016) for the detailed information on alternative instruments in this section.
Both mechanisms have strengths and weaknesses in terms of their goals. For example, emission control based on carbon trading is more compatible with market rationale; however, one may encounter serious problems during the monitoring, reporting, and verification (MRV) stages. In addition, decisions regarding the method for allocating trading quotas, whether positive pricing will be implemented during allocation, and how the price will be deter-mined are of strategic importance to the functioning of the ETS system.
Conversely, control mechanisms based on taxation cause rigidities be-tween direct producers and end users and influence the decisions of market participants. Taxes, renewable energy subsidies, project support for increas-ing energy efficiency, and regulations on energy efficiency in buildincreas-ings are among the main instruments that could serve the development of a low-carbon economy in Turkey. However, the relatively high taxes (particularly per unit price of electricity and motor fuel in Turkey), which are also incorporated in the financial regulations on environmental protection, do not serve the purpose of achieving meaningful progress in reducing CO2 emissions. For instance, Fig. 3.5 demonstrates an environmental tax burden that amounts to 4%–5% of national income in Turkey. It is noteworthy that the definition of environmentally related taxes also encompasses energy and fuel taxes, which are not necessarily levied with any environmental concerns. In comparison, the environmental tax rate in OECD countries is approximately 1%–1.5%. Despite this, the growth of CO2 emissions can-not be held in check in Turkey, therefore the exclusive use of taxation has failed to successfully protect the environment and mitigate climate change. Figure 3.5 Environmental taxes as a share of GDP, 1994–2014. (OECD (www.oecd.org)).
The main problem here is that, despite taxation, there has been a failure to develop alternatives to the energy-intensive linear processes with low-resource efficiency. In cases where alternative options are not promoted, the only outcomes from high taxation are mounting production costs and increased revenues for the government. In addition, no meaningful prog-ress is achieved in mitigating the environmental effects. However, across Europe and in other industrialized countries, improving energy efficiency and developing alternative renewable energy sources are the preconditions for successfully tackling environmental pollution. Rather than adopting tax practices that serve to increase the costs of environmental policies and bud-get revenues, Turkey should undertake the necessary technological transfor-mations to improve energy efficiency and seek to incorporate renewable energy sources (i.e., wind and solar power) into its economy.
3.3.1 Emissions Trading Systems and the Turkish Experience
Despite being an Annex 1 country, Turkey is not included in the Kyoto Protocol’s Annex B due to its special circumstances.6 Therefore no emission limits have been set for Turkey, and it is currently not in a position to benefit from these flexible mechanisms or participate in relevant markets. Therefore Turkey has to date been trading solely in the voluntary carbon market.The voluntary carbon market is a scheme that, so far, seems to approxi-mate the ETS to the greatest degree. The trading volume of the voluntary carbon market was observed to be USD 4.5 billion between 2004 and 2011, as a result of which 1 billion tons of CO2 emissions were offset. Turkey ac-counted for USD 207 million of the voluntary trading during this period, which enabled it to offset 31.7 million tons of emissions. The Ministry of Environment and Urbanization (MEU) reported that Turkey had 308 projects registered in the voluntary carbon market in 2014, amounting to 20 million tons of CO2 allocation.7 According to the two mechanisms of voluntary emission reduction standards (the voluntary carbon standard and the gold standard), Turkey is the third largest supplier after China and India. In 2015 Turkey supplied 3.2 million tons of CO2 eq., but was found to offer
6 Since Turkey is one of the founders of the OECD, which mainly consists of developed and industrialized countries, it is considered among the “developed” countries by the UN-FCCC. However, the UNFCCC states that Turkey has “special circumstances” as it is a developing economy, which is not considered as an emerging economy or a country in transition. For further details see Turhan et al. (2016).
7 http://www.csb.gov.tr/projeler/iklim/index.php?Sayfa=sayfa&Tur=webmenu&
the lowest price (USD 1.3 per ton) among the 20 supplying countries. Of the offsets Turkey supplied, 97% came from renewable energy sources.
Control mechanisms based on carbon trading systems are regarded as another nascent instrument for Turkey. The most critical aspect of the ETS relates to the MRV of emissions. To ensure the efficient functioning of the system, accredited verification institutions and public agencies and institu-tions may be required to carry out these transacinstitu-tions. Difficulties experi-enced during the reporting of emission data may result in the suspension of countries from their trading system. For example, Greece8 and Bulgaria9 were previously suspended from carbon trading mechanisms on the grounds that they failed to comply with the United Nations GHG emission report-ing rules. Havreport-ing recently been included in voluntary markets, Turkey must undertake to set up, within the context of its EU membership perspective, the necessary legal infrastructure for operating a MRV system in accordance with the EU ETS. To this end, Turkey issued the “Regulation on Monitor-ing of Greenhouse Gas Emissions”10 on June 25, 2012; the “Communiqué on Monitoring and Reporting of Greenhouse Gas Emissions”11 on July 22, 2014; and the “Communiqué on Verification of Greenhouse Gas Emissions and Accreditation of Verifiers”12 on April 2, 2015.
Strengths, weaknesses, opportunities, threats (SWOT) analyses, conduct-ed by the MEU, identificonduct-ed the most significant shortcomings and challenges that impede the development of the ETS in Turkey include an insufficient degree of deepening in national financial markets, a lack of institutional competence on the part of financial control mechanisms, and a failure to eliminate deficiencies in control and monitoring systems (MEU, 2016).
Even though Turkey has not been able to make use of the financial re-sources earmarked for climate change mitigation that have been provided to countries with similar economic indicators, climate change mitigation has become a key agenda item for Turkey. The fact that Turkey could not previ-ously benefit from flexibility mechanisms under the Kyoto Protocol and had to carry out high-cost technology transfers, has undermined the country’s ef-forts to develop the sufficient financial resources required to reduce emissions and accommodate the negative effects of climate change. As a consequence
8 http://www.enn.com/pollution/article/35122. 9 http://www.reuters.com/article/us-bulgar ia-co2-suspension-idUSTRE65S-3RU20100629. 10 http://www.resmigazete.gov.tr/eskiler/2014/05/20140517-3.htm. 11 http://www.resmigazete.gov.tr/eskiler/2014/07/20140722-5.htm. 12 http://www.resmigazete.gov.tr/eskiler/2015/04/20150402-12.htm.
the emergence of established practices in Turkey regarding building capaci-ties, raising awareness, and adopting cost-efficient emissions reduction op-tions within the context of carbon trading system has been delayed.
Conversely, the recent momentum in renewable energy investments, where emission reduction certificates that have been traded in voluntary markets since 2006 are obtained, constitutes an important step towards the emergence of an emission trading market for Turkey. There have been sub-stantial reductions in the EU ETS and regional carbon prices following the 2008 crisis. Nonetheless, the revisions made to the Renewable Energy Law in 2010 have contributed to the continuation of renewable energy investments (Ari and Sari, 2015). At the same time, the Partnership for Mar-ket Readiness (PMR) project, coordinated by the MEU, was initiated to achieve institutional capacity building regarding the ETS. It is hoped that this project will mobilize the country’s emission trading potential, provided that favorable market conditions emerge in the future and that Turkey takes its place in the global climate regime in line with its “common but differ-entiated responsibilities and respective capabilities” under the UNFCCC. However, it should be noted that projects with high additionality can ben-efit from the ETS. As a G20 country with a growing economy, Turkey’s reduction portfolio should not rely exclusively on the ETS for emission reduction projects and activities.
3.3.2 Partnership for Market Readiness Project
Endeavors intended to develop MBMs in Turkey are being carried out us-ing funds provided by the World Bank within the framework of the PMR. As it attempts to address alternative market-based instruments for carbon pricing, and assess the suitability of each instrument by analyzing Turkey’s existing institutional infrastructure, this project tackles five other instru-ments in addition to the ETS, including: (1) carbon taxation; (2) energy ef-ficiency trading; (3) renewable energy trading; (4) result-oriented financing; and (5) comprehensive crediting.
Discussions are being held regarding the design and implementation of each alternative instrument, the compatibility of instruments with existing policies and with one another, the legal and institutional gap analysis, and the revenue utilization methods.
Carbon Taxation
The legal and institutional basis required for the carbon taxation mecha-nism is not yet in place in Turkey. Since sectoral carbon taxes can only be
determined using GHG emission data, the availability of the MRV mecha-nism is a precondition for this system.
Energy Efficiency Trading (Trading of Energy Efficiency Certificates)
A strong legal and institutional infrastructure, which is necessary for the im-plementation of this mechanism, is not yet available in Turkey. As mentioned above, an MRV system should also be established for energy efficiency.
Renewable Energy Certificates Trading (REC Trading)
There is also no readily available legal basis for REC trading in Turkey. Improving the current laws and regulations concerning renewable energy is imperative for the functioning of such a system.
Result-Oriented Financing
Result-oriented financing is a form of financing offered in exchange for the implementation of a project and the provision of a service. The state (or other funding institutions) provide financial support for programs that make investments in accordance with predetermined emission reduction targets and successfully meet these targets.
Comprehensive Crediting Mechanism
The clean development mechanism, which is a “project based” certificate trading mechanism, forms the basis of a comprehensive crediting mecha-nism. What distinguishes a comprehensive crediting mechanism is that it is developed within the scope of a national or regional program. Emission reductions achieved by sectoral, national, or regional scale programs, and policy tools providing credits for performances extending beyond a pre-determined emission target or threshold, are certified and traded. This is regarded as a MBM suitable for rapidly-growing sectors.
Given Turkey’s current preliminary institutional and legal arrangements, comprehensive crediting and result-oriented financing are the most feasible options compared to the other alternatives. Steps towards an MRV mecha-nism are reported to be underway.
Another significant endeavor under the PMR project has been discus-sions on Turkey’s legal preparations. The gap analysis conducted during these discussions revealed that laws and regulations, particularly in the field of MRV in Turkey, have already been studied, and future endeavors should focus on how this system can be designed in an EU ETS compatible way (MEU, 2016). Determination of ETS quotas and identification of allocation methods are two of the main priority areas. Conversely, the stability and
predictability of the carbon market and prices have not yet been adequately ensured at the international level. It is anticipated that international exper-tise on these issues will needed to be transferred to Turkey.
Even though the direct processes of quota determination and allocation have not yet been initiated in Turkey, the PMR study has established that the 21% reduction target put forward by the INDC may be used as an ex-ample. As the INDCs overall target will be reviewed every 5 years, it is con-sidered possible to design quota allocations in the PMR documentation on the basis of the INDC commitment target. The fact that the existing INDC projections do not include sectoral differentiations leads to uncertainties concerning the scheme. On the other hand, as seen within the context of the macroeconomic model below, economic transformations that are con-sistent with Turkey’s 21% (reductions from BAU) target will constitute a significant input to this decision.
In quota allocation, two options stand out in the PMR documentation. The first option relates to the absolute quota limitation under fixed reserves. It has the advantage of offering precise and clear goals in the pilot implemen-tation stage. With this option, prospective allocations can be determined on the basis of historical observations in a way that is consistent with the INDCs overall target. Under the current INDC target, these allocations amount to a 1.3% decline in carbon intensity.
The second option in quota allocation can be defined as growth-oriented
absolute quota allocation. Here, variable or flexible reserves may be allocated
to new participants depending on the quota level, the INDC-compatible carbon intensity reduction target (1.3%), and growth projections for the economy (for the relevant sector). Therefore new participants will be in-tegrated into the system and the emergence of “big” players in the system may be avoided.
The main shortcoming of both options is their failure to provide suf-ficiently detailed carbon emission data at the sectoral level, therefore data inventory improvements are crucial for the implementation of this step. In particular, possible fluctuations in business cycles raises serious concerns regarding the updating of such data inventories, as well as the predictability of the growth path. In this context, it is assessed that a proper ETS may be established after firms have acquired MRV experience. Nevertheless, it is important that a dynamic, rather than a fixed growth-oriented, approach be adopted when determining the upper limit in the system, and that firms be consulted for assessing their long-term plans and sectoral growth projec-tions, as well as the sector’s own dynamics.
Some of the most significant experience that Turkey can attain regard-ing the EU ETS relates to the issue of carbon price volatility and predictability. Carbon price, as a “market price,” should undoubtedly be allowed to float freely; however, in this type of market market, drastic reductions in the price can slow the emission trading activities, while very high prices tend to increase trading risks as well as the system’s burden on production costs. The PMR documentation defines three alternative systems based on the European experience:
• Price corridor: In this system, upper and lower price limits are determined using historical data and business cycle projections. Its technical conve-nience is among its major advantages; however, the necessity to actively maintain the width of the corridor may lead to fairness and reliability issues in practice.
• Market price reserve system: This system will be implemented by the EU in 2019. Minimization of interventions to market rationale is the main advantage of this system; however, the main drawback for Turkey is its potential to cause uncertainties in the pilot implementation period. • Supply-side measures: Alongside the price corridor, “bidding” is intended
to be actively used in this system. Active supply-side policy measures will reinforce the will of the system’s regulating authority although it may also add to the uncertainties in the system.
The ETS pilot scheme seeks to transfer MRV expertise to market deci-sion makers and is intended for use for a maximum of 3 years. The ETS pilot scheme is envisaged to rest on the elements cited below (for further information see the PMR documentation of the MEU):
• Scope: The ETS pilot scheme can be structured to conform with the MRV design.
• Quota level and allocation: The total quota level can be specified in ac-cordance with sectoral production levels or growth predictions. Here, a 1.3% annual decline in carbon intensity may be targeted based on the average of the last 3 years of historical emission data and with the INDC target. A common denominator for reductions may also be added to the design in order to ensure harmonization among sectors.
• Offset design: Offsets may be utilized for emission reduction projects that were put into effect up until 4 years before the commencement date of the pilot scheme, provided that these projects are included in the gold standard or voluntary carbon standard system.
• Provisional flexibility: Banking and borrowing options may be offered during the pilot implementation stage.
• Market entry and trading: Emission trading accounts should be centrally filed. They may be open to the firms within the ETS and to domes-tic financial institutions. Financial system rules will be confined exclu-sively to the trading of permits and will preclude other permit-derived instruments.
• Sanctions: Sanctions will only be imposed to ensure the observance of compliance rules and will be gradually lifted during the pilot imple-mentation period.
• Linkages: The pilot ETS will not be linked to any other ETS.
It is well-documented that price instruments administered through the market alone are not sufficient to achieve the broad objectives of controlling global GHG concentrations, or to fully assist in maintaining a sustainable and eco-friendly growth path (Acar et al., 2014). Part of the problem is that the development of novel eco-friendly technologies typically involves positive spillovers in the form of agglomeration effects, knowledge diffusion, cross-firm externalities, and industry-wide learning; however, the decentralized optimization embedded in the laissez-faire actions of the markets may fail to capture these positive spillovers. Market failures are at the root of these prob-lems, as although basic (economic and regulatory) instruments are available, their systematic use in broader policy packages has been lacking. In addition, there is a need to reevaluate the concept of green growth from a regional per-spective if one intends to focus on the spatial implications of sustained growth.
3.4 POST-PARIS AGENDA AND AN INTERNATIONAL
COMPARISON OF DEVELOPING COUNTRIES WITH RESPECT
TO CLIMATE CHANGE POLICIES
The Paris Agreement was adapted at the COP 21 summit held in Paris in December 2015, ratified by a sufficient number of countries through-out 2016, and entered into force on November 4, 2016. This agreement marks the beginning of a new era in the international climate regime. The fact that the agreement entered into force within less than a year after its adoption undoubtedly represents profound progress with regards to global climate change cooperation. Nevertheless, a busy negotiation agenda awaits the global climate diplomacy between 2016 and 2020.
Being an Annex 1 country within the UNFCCC means that Turkey assumes the same responsibilities as developed countries.13 Consequently, Turkey had to ensure that its special status was recognized during negotiations
13 We made use of Yeldan et al. (2016) to summarize the stance of Turkey with respect to global climate change diplomacy in this section.
on implementing the rules of the convention and the Kyoto Protocol. After prolonged deliberations, Turkey’s special status within the UNFCCC was recognized, but its status under the Paris Agreement remains unclear. This situation causes ambiguities as to how Turkey will benefit from financial resources, capacity building, and technology transfer supports earmarked for developing countries. Although the French and Moroccan presidencies made a joint statement to assure that “no party should be disadvantaged or excluded from the collective development of the rulebook simply because it is still in the process of joining the agreement,” the process may take a different turn (UNFCCC, 2016). Prolonging Turkey’s accession process due to the ambiguity concerning its status should not inhibit the country’s effective contribution to negotiations on the implementation of the Paris Agreement, and Turkey should reinforce its efforts to that effect.
The Paris Agreement reflects a global consensus to limit the average temperature rise to well below 2°C, even to 1.5°C if possible; however, na-tional contributions submitted to the UNFCCC Secretariat suggested that global temperatures will be 2.7–3.7°C warmer by the end of the century. The discrepancy between national contributions and the 1.5–2°C target is called the “emission gap.” To eliminate this gap it is imperative to reinforce the targets pertaining to the periods before and after 2020. In accordance with the agreement, the launching of a global dialogue on the revision of national contributions is envisaged to occur in 2018, as reduction targets are to be evaluated and strengthened every 5 years.
Turkey has pledged a 21% economy-wide emission cut under BAU by 2030, a goal that would allow its emissions to more than double over the next 15 years, increasing emissions by 116% in 2030 compared with 2012 levels. Such a plan would see Turkey’s emissions increase at an even faster rate than its growth over the past 10 years.
It is essential to assess Turkey’s INDC document in light of both the consensus embodied in the Paris Agreement and of other practices and strategic documents related to priority sectors. As mentioned above, the reduction scenario in Turkey’s national contribution document foresees that its emissions will be reduced to 929 million tons of CO2 eq. by 2030; in other words, the emissions will be double the 2013 level.4 This means that
its emission growth rate will be 40% higher in 2010–30 than in 1990–2010. From this perspective it is evident that Turkey should earnestly focus on the 5-year revisions stipulated by the Paris Agreement. Turkey’s INDC has been rated as “inadequate” by Climate Action Tracker.
Conversely, Mexico has set a more ambitious emission reduction tar-get, and aims to be 22% below baseline in 2030, which corresponds to
an emission increase of 56% above its 1990 levels. Similarly Brazil, one of the ten largest emitters, aims to limit GHG emissions [including land use, land-use change and forestry (LULUCF)] to 1.3 and 1.2 GtCO2 eq. by 2020 and 2030, respectively. Such targets are equivalent to a 37% and 43% reduction below 2005 levels, respectively. South Africa, despite being rated “inadequate,” aims to reduce its emissions to 398–614 MtCO2 eq. (includ-ing LULUCF) dur(includ-ing 2025–2030, stabilize its emissions over 2025–35, and finally reduce total emissions over the longer term. Ethiopia aims to de-crease its emissions by 64% below the BAU scenario by 2030. The INDCs of Mexico and Brazil are rated as “medium,” whereas Ethiopia’s is rated as “sufficient” by Climate Action Tracker (2016).14
3.5 CONCLUSION AND DISCUSSION: AVAILABLE
OPTIONS TO TACKLE WITH CLIMATE CHANGE
Scientific findings demonstrate that the new systems established by man-kind in the post-Industrial Revolution era have radically changed the global climate to an unprecedented degree. Levels of GHGs in the atmosphere (i.e., carbon and methane) have considerably increased in the last 200 years, reaching a level not seen in 800,000 years. The global atmospheric CO2 intensity, which had an average of 280 ppm prior to industrialization and never exceeded 300 ppm, went beyond 350 ppm in the 1980s, and is be-yond 400 ppm as of today.
The United Nations Intergovernmental Panel on Climate Change is-sued its fourth assessment report (AR4) in 2007. This report focused on keeping the global CO2 intensity below 450 ppm and limiting the global temperature rise to below 2°C, with a view of ultimately preventing the climate balance from being irreversibly disrupted. However, since the year the report was published, the carbon concentration has risen by 20 units in less than a decade.
The same report purports that the increased frequency of incidents (i.e., the ever-changing extreme weather conditions, droughts, decline in agri-cultural production, floods, sea level rise, new risks to human health, and ecosystem degradation) are also linked to the radical change we inflicted on the climate. The report emphasizes that the failure to limit temperature rise and launch adaptive mechanisms will intensify the abovementioned condi-tions in an unpredictable manner.
The Paris Agreement entered into force on November 4, 2016, follow-ing its adoption at the COP 21 summit in Paris in December 2015, and its ratification throughout the year by a sufficient number of countries. This agreement heralds the beginning of a new era in the international climate regime, and in this era it will not be viable to pursue a national policy rely-ing on the premises of the Kyoto Protocol. The most prominent feature of this new era is that it requires all state parties, both developed and develop-ing, to take measures to reduce emissions in accordance with the agree-ment’s precept of “common but differentiated responsibilities and respective capabilities.” This marks the end of the period under the Kyoto Protocol where only developed countries attempted to reduce emissions pursuant to concrete and quantitative targets. Developing countries only participated in the process on a voluntary basis through sectoral action plans and without setting any reduction targets. In the post-Paris Agreement period, both de-veloped and developing countries are expected to take part in the global fight against climate change by determining their reduction targets them-selves depending on their historical responsibilities and national capacities.
Turkey will be increasingly compelled to go along with the global ten-dency to reduce carbon intensity. In this new era, Turkey will need to trans-form all major carbon-generating sectors, increase the share of renewables in the primary energy mix, swiftly improve energy efficiency, adapt high-emission industrial sectors, and develop low-carbon transportation methods (i.e., railways and combined transportation).
Turkey’s untapped renewable energy potential can be considered as an opportunity from economic and environmental perspectives. The country has progressed in several areas of energy policy since 2005, and there are signs of better balance in energy policy goals in the future. To promote the development of renewable energy and to utilize Turkey’s renewable energy potential, Fossil Fuel Subsidies (FFS) can be reallocated to renewable energy projects to increase the level of support provided. The basic economics of renewable energy need to be altered by increasing the cost of fossil fuel-based energy (e.g., through taxes or equivalent mechanisms), by reducing the costs of renewable energy (e.g., subsidies), or by boosting the returns to renewable energies (e.g., through paying a premium for this form of energy).
Energy efficiency, in particular, will assume a prominent role in emission
reductions, as evidenced by global trends and in the IEAs analyses. It will also be crucial to transition to a system where renewable energy sources have a larger share and are more widely used, as is seen at the global level.
Renewables have accounted for two-thirds of the capacity increase in Tur-key’s electricity sector in the last 3 years, and this momentum is expected to accelerate. Nonetheless, subsidies and legal arrangements for fostering alter-native sectors must be handled in conjunction with market instruments. Improv-ing Turkey’s measurImprov-ing, monitorImprov-ing, and reportImprov-ing capacities; improvImprov-ing its transparency regarding its emissions and relevant policies; and regulating its accountability are also indispensable for the smooth implementation and functioning of emission reduction policies. In addition to emission reduc-tion, the benefits of transitioning to a low-carbon economy such as the prevention of air pollution, the reduction of energy import dependency, and the creation of new employment opportunities, should also be evaluated within this context.
Turkey’s need for an inclusive multifactor climate policy-making pro-cess still prevails. The insurance and financial sectors, which are directly exposed to the present and future ramifications of climate change, should take an appropriate position and be prepared in this regard. Climate policies not only signify a multilayered issue influencing a multitude of sectors, but also necessitate extensive knowledge, scientific research, and discussion with respect to possible solutions and emerging global trends. For this reason it is important to ensure that in the process of devising policies for climate change mitigation, multilateral negotiations continue to involve the public sector, businesses, academies, and nongovernmental organizations.
MBMs that can be implemented against climate change are grouped into two general approaches in the environmental economics literature: (1) taxation or subsidies, and (2) quota allocation-based carbon trading sys-tems. The most prominent example among carbon trading systems was designed by EU members within the scope of the Kyoto Protocol. Both approaches have strengths and weaknesses in terms of their goals. Emission control based on carbon trading is more compatible with market ratio-nale; however, one may encounter serious problems during the supervision and monitoring stages. In addition, decisions regarding which method will be adopted for allocating trading quotas, whether positive pricing will be implemented during allocation, how the price will be determined, and how sectoral allocations will be specified are all of critical importance to the suc-cess of the system. Moreover, sectoral variability and firm participation are also essential for the structuring of the system. On the other hand, control mechanisms based on taxation cause rigidities between direct producers and end users and may adversely influence the decisions of market agents. Furthermore, relatively high taxes in Turkey, which are also incorporated in
the financial regulations on environmental protection, do not successfully achieve meaningful reductions in CO2 emissions. The results obtained show that the high-taxation policy adopted by Turkey has failed to bring about considerable progress in the reduction of CO2 emissions.
The main source of the problem is that, despite taxation, there has been a failure to develop alternative sources to the energy-intensive resource-inefficient polluting processes. In cases where substitutes for polluting in-dustrial processes are not developed, the only outcomes of high taxation are increased production costs and increased revenues for the treasury, with no meaningful success in environmental pollution reduction.
Efforts to realize emission reduction through MBMs are under global discussion under the topic of “emission trading.” Functioning on both com-pulsory and voluntary bases, this system seeks to measure GHG emissions generated by economic activities (in terms of carbon equivalents), price these emissions, make countries adopt or espouse them through quotas, and thus facilitate carbon trading at a global level. The ultimate aim is to incite actors to embrace GHG emission costs, known as externalities, and en-courage them to use clean efficiency-improving technologies and thereby reduce their emissions.
REFERENCES
Acar, S., Challe, S., Christopoulos, S., Christo, G., 2014. Fossil Fuel Subsidies as a Lose-Lose: Fiscal and Environmental Burdens in Turkey. Presented at the 14th IAEE European Energy Conference, Rome, Italy, 28–31 October.
Acar, S., Kitson, L., Bridle, R., 2015. Subsidies to Coal and Renewable Energy in Turkey. Global Subsidies Initiative Report. IISD, March.
Acar, S., Yeldan, E., 2016. Environmental impacts of coal subsidies in Turkey: a general equi-librium analysis. Energy Policy 90, 1–15. doi: 10.1016/j.enpol.2015.12.003.
Ari, İ., Sari, R., 2015. The role of feed-in tariffs in emission mitigation: Turkish case. Renewable Sustain. Energy Rev 48, 768–775. doi: 10.1016/j.rser.2015.04.006.
Baris, K., Kucukali, S., 2012. Availability of renewable energy sources in Turkey: current situa-tion, potential, government policies and the EU perspective. Energy Policy 42, 377–391.
Benli, H., 2013. Potential of renewable energy in electrical energy production and sustain-able energy development of Turkey: performance and policies. Renewsustain-able Energy 50, 33–46.
Bridle, R., Kitson, L., 2014. The Impact of Fossil-Fuel Subsidies on Renewable Electricity Generation. International Institute for Sustainable Development (IISD)—Global Sub-sidies Initiative (GSI), Report, Available from: https://www.iisd.org/gsi/sites/default/ files/ffs_rens_impacts.pdf.
Herdem Attorneys at Law, 2013. Turkey Energy Report. Available from: http://www.
herdem.av.tr/resimler_site/2013_TURKEY_ENERGY_REPORT_FINAL.pdf.
International Energy Agency (IEA), 2013a. Tracking Clean Energy Progress 2013: IEA Input to the Clean Energy Ministerial. OECD/IEA, Paris, France, Available from: http:// www.iea.org/publications/TCEP_web.pdf.
International Energy Agency (IEA), 2013b. Turkey Oil and Gas Security: Emergency Re-sponses of IEA Countries. OECD, Paris, France.
International Energy Agency (IEA), 2016. Energy Policies of IEA Countries: Turkey. Available from http://www.oecd-ilibrary.org/energy/energy-policies-of-iea-countries_ 19900082.
MEU, September 27, 2016. Karbon Piyasalarına Hazırlık Ortaklıg˘ı Projesi Emisyon Ticaret Sisteminin Türkiye’ye Uygunlug˘unun Deg˘erlendirilmesi Biles¸eni Son Çalıs¸tayları, Ek Dosyalar. Available from: https://www.csb.gov.tr/projeler/iklim/index.php?Sayfa=habe rdetay&Id=64883.
Ren21, 2013. Renewable Energy Policy Network for the 21th Century. Renewables 2013 Global Status Report. Available from: http://www.ren21.net/REN21Activities/ GlobalStatusReport.aspx.
Republic of Turkey, 2005. Law on Utilization of RES for the Purpose of Generating Elec-trical Energy. Available from: http://www.eie.gov.tr/eie-web/english/announcements/
YEK_kanunu/LawonRenewableEnergyReources.pdf.
Republic of Turkey, 2009a. Electricity Energy Market and Supply Security Strategy Paper. Schreiber, H., 2004. Risk Sharing and Renewable Energy. The Case of Geothermal Energy
Projects. International Geothermal Days, Zakopane, Poland, September 13-17.
Turhan, E., Mazlum, S.C., Şahin, Ü., Şorman, A.H., Gündog˘an, A.C., 2016. Beyond special circumstances: climate change policy in Turkey 1992–2015. WIREs Clim. Change 7 (3), 448–460.
Turkish Electricity Transmission Company (TEIAS), 2013. Turkish Electricity Production Planning Study (2005–2020). Available from: http://www.teias.gov.tr/Eng/ apkuretimplani/veriler.htm#_Toc86219420.
UNFCCC, 2016. Aggregate effect of the intended nationally determined contributions: an update, Synthesis report by the secretariat, Advanced version, FCCC/CP/2016/2, 2 May 2016, http://unfccc.int/resource/docs/2016/cop22/eng/02.pdf.
United Nations. Economic Commission for Africa. Subregional Office West Africa (SRO-WA) (2013-03). Inclusive green growth to accelerate socio-economic development in West Africa. UN. ECA Intergovernmental Committee of Experts (16th ICE) of West Africa (16th session: March 2013: Abidjan, CÔTE D’IVOIRE). http://hdl.handle. net/10855/22124.
Yuksel, I., 2013. Renewable energy status of electricity generation and future prospect hydropower for Turkey. Renewable Energy 50, 1037–1043.
FURTHER READING
Doukas, A., Acar, S., 2015. G20 Subsidies to Oil, Gas and Coal Production: Turkey. Back-ground Paper to the report Empty Promises: G20 Subsidies to Oil, Gas and Coal Produc-tion. Jointly prepared by the IISD, OCI and ODI.
IEA, 2010. Deploying Renewables in Southeast Asia: Trends and Potentials.
MVV Consultants and Engineers GmbH, 2004. Energy Efficiency Strategy for Turkey. Berlin, Germany. Available from: http://www.eie.gov.tr/eie-web/TK%20EE%20strategy%20 -%20revised_04062004.pdf.
Republic of Turkey, 2009b. Republic of Turkey Ministry of Energy and Natural Resources Strategic Plan (2010–2014). Available from: http://www.enerji.gov.tr/yayinlar_raporlar_ EN/ETKB_2010_2014_Stratejik_Plani_EN.pdf.
UNFCCC, 2013. National Greenhouse Gas Inventory Data for the period 1990–2011. Available from: http://unfccc.int/resource/docs/2013/sbi/eng/19.pdf.
Yeldan, et al., 2016. Ekonomi Politikaları Perspektifinden İklim Deg˘is¸iklig˘i ile Mücadele. TÜSİAD- T/2016 T/2016,12 – 583.